


What a Good CAC Means for a B2B SaaS Company

A good customer acquisition cost (CAC) is one your business can recover from customer gross profit without undermining retention, service quality, or a sustainable growth plan.
That answer varies by annual contract value (ACV), sales motion, gross margin, payback tolerance, and expansion. A single dollar target cannot fairly compare every B2B SaaS business.
CAC depends on the customer economics
A company selling a low-priced self-serve product needs a different acquisition model from a vendor running security reviews, pilots, and procurement for six-figure contracts.
Long sales cycles often require sales engineering, implementation planning, and more buyer education. Those resources raise acquisition costs, but a larger contract may support them.
Include gross margin and retention
Gross margin matters because revenue does not equal cash available to recover acquisition spending. Cloud infrastructure, support, onboarding, and service delivery can change contribution.
Retention also changes the acceptable investment. A low initial CAC can still be unprofitable if customers leave before the business recovers onboarding and acquisition costs.
Separate customer CAC from CAC ratios
CAC per new customer divides acquisition cost by the number of new customers. A CAC ratio compares sales and marketing expense with new or total new annual recurring revenue.
These measures answer different questions. The first estimates cost per account; the second shows how much sales and marketing investment produces each dollar of recurring revenue.
| Input | Example | Use |
|---|---|---|
| Media spend | $120,000 | Media CAC numerator |
| Sales and marketing cost | $300,000 | Loaded CAC numerator |
| New customers | 20 | Shared denominator |
| Media CAC | $6,000 | Channel efficiency |
| Loaded CAC | $15,000 | Business economics |
State which measure you mean whenever you share a benchmark. Calling a channel-only figure “CAC” without qualification can hide sales, marketing operations, and agency costs.
Keep these economic measures separate during review:
- Media CAC by qualified customer cohort
- Fully loaded sales and marketing CAC
- Gross-margin CAC payback period
- Retention and expansion by acquisition cohort
How to Calculate Media CAC and Fully Loaded CAC

Start by defining the customer cohort, expense window, attribution rule, and customer event. Keep those definitions consistent before comparing campaigns or reporting periods.
Separate paid media CAC from fully loaded CAC. A platform dashboard may report conversions, but finance needs reconciled customer counts and clearly allocated costs.
Write down the calculation first
Use explicit formulas in your spreadsheet or reporting specification. Replace the example cost categories with the costs your finance team approves for acquisition reporting.
Paid media CAC = Paid media spend / New customers attributed under the defined model
Fully loaded CAC = Allocated acquisition sales and marketing cost / New customers acquired
CAC payback months = Fully loaded CAC / Monthly gross profit per new customer
For payback, monthly gross profit per customer can be estimated from recurring revenue and gross margin. Use consistent cohort values rather than mixing averages from unrelated periods.
Build a worked example with reconciled inputs
Suppose a campaign spends $60,000 and produces 20 newly paying customers under a documented attribution rule. Its channel-level media CAC is $3,000.
Assume the business also allocates $180,000 of sales, marketing, and acquisition operations expense to those same 20 customers. Fully loaded CAC is then $12,000 per customer.
Calculate payback from gross profit
If each customer signs a $24,000 annual contract and gross margin is 80%, first-year monthly gross profit is about $1,600 before expansion or churn.
Dividing $12,000 by $1,600 gives a simple estimated payback of 7.5 months. Actual cash recovery depends on billing terms, onboarding costs, collections, and retention.
Read the result as an example, not a target
The example is not a recommended target. It shows why the same $3,000 media CAC can coexist with a much larger company-wide acquisition cost.
Replace every illustrative input with reconciled company data and show sensitivity ranges before using the result for budget, pricing, or hiring decisions.
Replace these example inputs with reconciled company data:
- Included spend and loaded labor
- Qualified customers in the cohort
- Gross margin and revenue timing
- Retention and attribution assumptions
Validate CAC Attribution and Channel Outcomes

CAC depends on rules that connect spend, leads, opportunities, customers, and revenue across advertising, analytics, CRM, and finance systems.
Treat attribution as a documented operating convention, then test whether the chosen rule supports better decisions without overstating causal certainty.
Use attribution as an operating rule, not a fact of nature
Choose one primary model for routine reporting, such as first-touch, sourced pipeline, or a defined multi-touch method. Record its limits and keep the model stable across comparisons.
Paid media attribution often overstates its contribution when campaigns overlap with sales outreach, events, partner referrals, or existing brand demand.
Use holdouts to test attribution
Use holdouts or matched cohorts when volume and tracking quality allow. Treat the result as directional if assignment is not randomized or the sample is small.
Compare a credible unexposed group when practical, preserving eligibility, timing, geography, and other material differences that could distort the observed outcome.
Connect channel reporting to customer outcomes
For practical campaign setup and qualified pipeline tracking, see the B2B Google Ads playbook.
Keep the cost definitions connected to customer outcomes. A click, form fill, or opportunity is not a new customer and should not appear in the CAC denominator.
Reconcile these records before accepting channel CAC:
- Campaign spend and approved cost scope
- Qualified CRM opportunities and customers
- Finance revenue and margin evidence
- Cohort timing, exclusions, and attribution rule
Compare CAC Benchmarks by ACV and Sales Motion
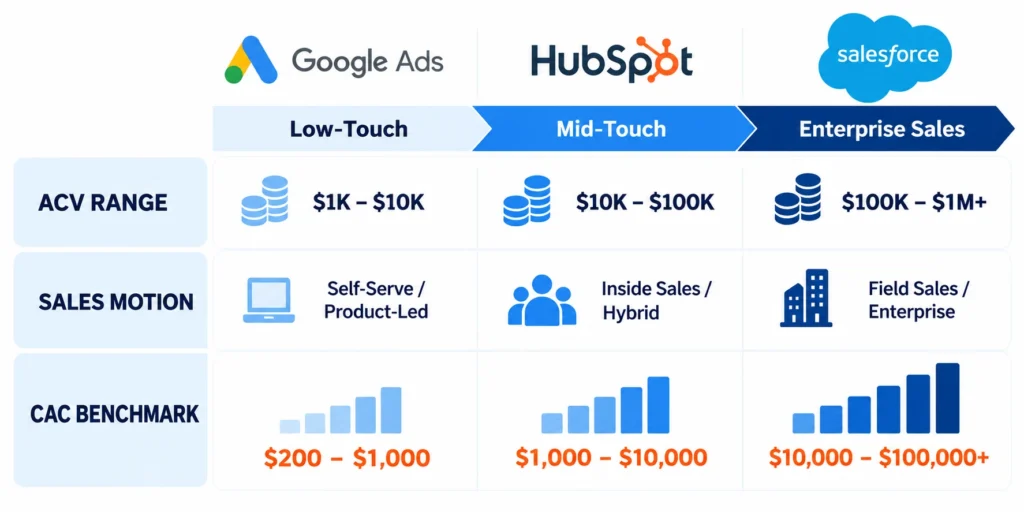
Benchmarks are useful only when the peer group resembles your business. Compare contract value, sales motion, customer segment, company stage, and the metric definition.
Benchmarkit’s 2025 report presents 2024 SaaS results and shows why ACV matters for CAC payback. Its payback chart covers 148 observations across ACV bands.
Use ACV-specific payback figures as context
The report’s 2024 median CAC payback varied substantially across ACV segments. These figures describe a surveyed B2B SaaS cohort; they are not universal targets.
| Evidence | Use | Caution |
|---|---|---|
| Company cohort | Compare similar ACV and motion | Check definitions and periods |
| External study | Set a contextual range | Do not copy one target |
| Channel report | Diagnose media performance | Exclude unqualified conversions |
| CRM and finance | Validate customers and margin | Reconcile source differences |
| Retention data | Interpret acceptable payback | Use mature customer cohorts |
Benchmarkit reports these values for its surveyed population, not for paid media CAC alone. The figures are median payback, not an amount to spend on advertising.
Check whether the benchmark is like-for-like
Before using a published number, check its sample size, data period, company type, expense scope, revenue denominator, and calculation method.
Benchmarkit’s 2025 report gives a median new-customer CAC ratio of $2.00 in sales and marketing expense per $1.00 of new-customer ARR, based on 73 responses.
Check these dimensions before comparing CAC evidence:
- ACV, pricing, and gross margin
- Sales motion and cycle length
- Included costs and customer definition
- Cohort maturity and retention period
Distinguish the ratio from cost per customer
That ratio is not $2 of spend per customer. It compares expense with recurring revenue and should not be confused with paid-media CAC or customer payback.
A revenue-to-CAC ratio summarizes value relative to acquisition cost, while CAC itself measures the cost allocated to each acquired customer.
Interpret External CAC Evidence Carefully
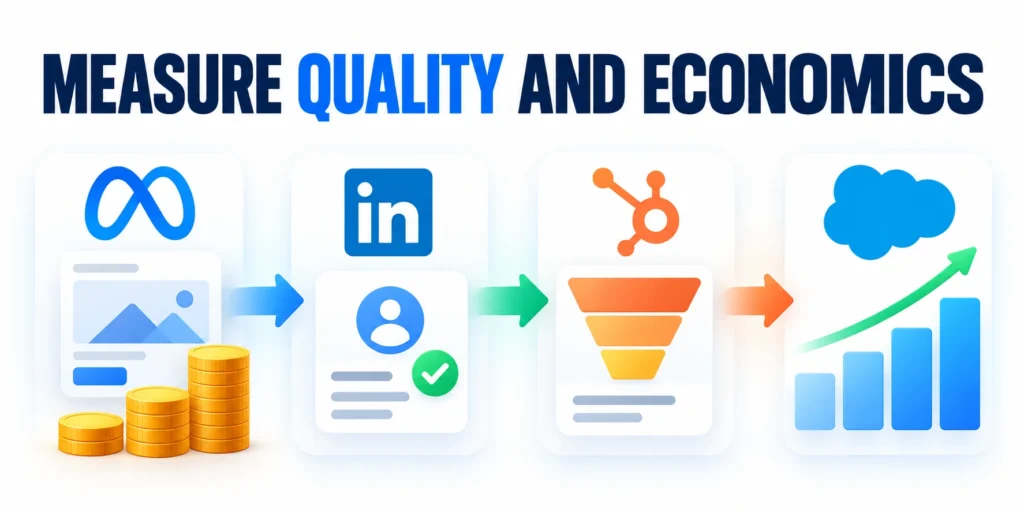
External benchmarks can reveal plausible ranges and questions, but they rarely share one definition, cost scope, cohort, sales motion, or customer maturity.
Use published evidence as context for investigation, then anchor decisions in the company’s reconciled acquisition and customer economics.
Compare broader SaaS evidence carefully
The report also notes CAC ratios vary with ACV. A higher ratio may accompany a larger contract and different sales effort, so compare payback and margin too.
High Alpha’s 2025 SaaS benchmarks likewise emphasize the relationship between retention and CAC efficiency. Its survey describes a broad SaaS respondent group, not a paid-ad-only cohort.
Treat channel benchmarks as hypotheses
Public reports rarely provide a fully comparable paid-media CAC for your exact ACV, region, sales cycle, and attribution model. Avoid copying an isolated number into a budget.
Instead, use your own qualified customer cohorts to test whether a channel can meet the economics required by your offer and delivery model.
Connect acquisition with customer value
For the wider link between acquisition spend and customer value, use the CRM investment ROI framework as a complementary measurement reference.
Review gross margin, retention, expansion, service cost, payment timing, and customer concentration before deciding whether a higher CAC remains economically supportable.
Use these customer economics when interpreting the range:
- Gross margin and service cost
- Retention and expansion by cohort
- Payment timing and cash recovery
- Customer concentration and downside risk
Turn a CAC Benchmark into a Budget and Stop Rules
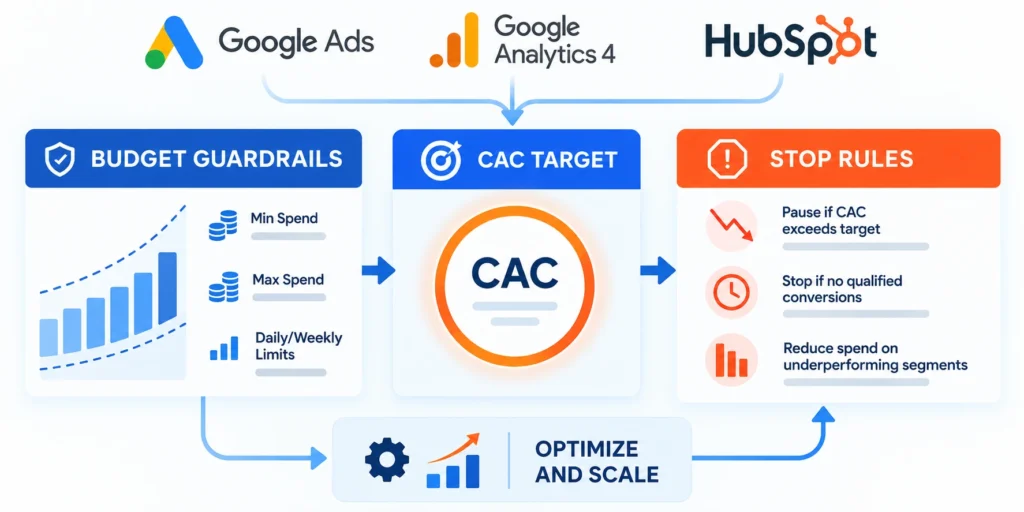
Translate an acceptable payback period into an approximate acquisition-cost ceiling, then subtract the non-media costs needed to win and onboard customers.
Set a budget using a realistic customer target and a test plan. Do not multiply an industry median by a campaign forecast and call the result a validated budget.
Calculate a company-specific CAC ceiling
Suppose ACV is $25,000 and gross margin is 80%. Approximate annual gross profit is $20,000, or about $1,667 monthly before churn or collection effects.
If leadership chooses a 12-month payback ceiling, the simplified fully loaded CAC ceiling is about $20,000. That is a planning assumption, not an industry benchmark.
Set Economic Guardrails Around the Ceiling
Treat the ceiling as a maximum under defined assumptions, not permission to spend whenever platform-reported conversions appear inexpensive or early funnel volume rises.
Review these economic constraints before approving the ceiling:
- Gross margin after delivery and support costs
- Retention and expansion by mature cohort
- Cash collection and payback timing
- Sales capacity and qualified opportunity volume
- Downside scenario and available working capital
Assign finance and commercial owners to refresh assumptions when pricing, product mix, margin, retention, payment terms, sales motion, or customer concentration changes.
Document which assumption would invalidate the ceiling, which evidence reveals the change, and who can reduce spending while finance and commercial leaders reassess the approved range responsibly.
Translate CAC Limits into Channel Budgets

A company-level CAC ceiling does not become a channel budget until teams account for conversion, sales capacity, evidence lag, creative cost, and qualification quality.
Translate the ceiling into a bounded test with explicit assumptions, stop rules, and enough time for qualified customer outcomes to mature.
Translate the ceiling into channel spend
For 12 new customers, the implied total acquisition-cost envelope is $240,000. Paid media receives only the portion left after sales salaries, commissions, tools, agencies, and other allocated costs.
If those other acquisition costs total $150,000, the remaining $90,000 is a rough media envelope. Recheck the allocation, attribution, sales capacity, and delivery costs before committing it.
Plan scenarios instead of promising one forecast
| Scenario | CAC assumption | Decision |
|---|---|---|
| Lower case | Higher cost, slower conversion | Protect test budget |
| Base case | Observed funnel assumptions | Run controlled plan |
| Upper case | Better quality and retention | Scale after evidence |
| Stop case | CAC exceeds approved ceiling | Pause and diagnose |
Model the number of sales-qualified accounts, opportunities, wins, and expected start dates. Carry uncertainty through each stage rather than assuming every click becomes a customer.
Use lower, base, and upper cases with explicit conversion, sales-cycle, retention, margin, and spending assumptions rather than presenting one precise outcome.
Set stop rules before the campaign starts
Follow this sequence to set stop rules before the campaign:
- Write down the target cohort, offer, attribution window, and business outcome before launch.
- Define the review date and minimum evidence required to continue spending.
- Pause weak campaigns after the agreed spend or time threshold without qualified progress.
- Check tracking, audience fit, landing-page experience, and sales follow-up before blaming the channel.
- Release additional budget only when customer quality and delivery capacity remain acceptable.
Stop rules prevent sunk-cost thinking. They also protect a useful campaign from premature cancellation by requiring a fair time window and reliable tracking.
Pair every threshold with an observation window, minimum evidence, accountable decision owner, diagnostic step, and recovery or reallocation action.
Define these controls before releasing channel budget:
- Approved CAC ceiling and evidence window
- Minimum qualified conversion volume
- Sales capacity and pipeline guardrails
- Pause, diagnosis, and reallocation owner
Build a Practical CAC Benchmarking Workflow
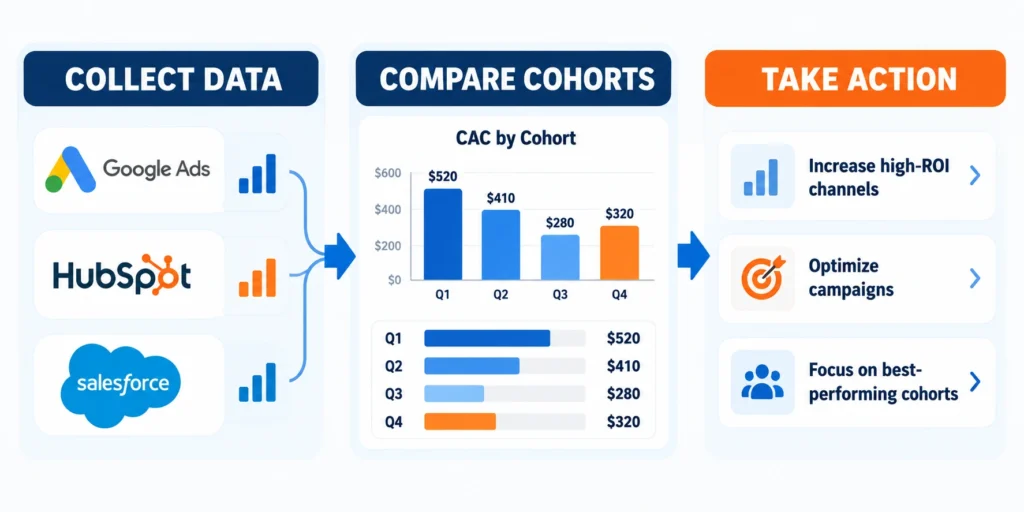
A durable benchmark starts with shared definitions and reconciled data, not a dashboard screenshot. Marketing, sales, finance, and customer success need compatible cohort rules.
Run one review cycle on a focused segment before expanding the model. Document assumptions so future comparisons remain interpretable when staff or platforms change.
Create the cohort record
Build one row per reporting cohort in your CRM export or approved finance model. Keep a shared definition sheet beside the results.
Use these actions to create the cohort record:
- Cohort start and end dates, with the timezone and reporting window.
- Customer segment, ACV band, region, and sales motion.
- Paid media spend and the included platform, agency, and creative costs.
- Allocated sales and marketing expense used for fully loaded CAC.
- New customers and new ARR, reconciled to billing or finance records.
- Gross margin assumption, payback period, retention, and expansion status.
- Attribution model, data owner, refresh date, and known limitations.
Use stable customer and campaign identifiers. Deduplicate converted accounts and avoid counting multiple contacts from one buying group as multiple customers.
Reconcile before calculating
Follow this sequence to reconcile before calculating:
- Agree on what counts as a new customer and which acquisition costs belong in scope.
- Export campaign costs for the same period and currency as the customer cohort.
- Match new wins to CRM and billing records; remove duplicates and test cancellations.
- Separate expansion, renewals, and reactivations unless the analysis explicitly includes them.
- Calculate media CAC, fully loaded CAC, new CAC ratio, and payback as distinct measures.
- Ask finance and sales operations to review the definitions and sample records.
If your business uses CRM data for investment decisions, the site’s CRM ROI guide offers additional ideas for aligning cost and outcome reporting.
After the data is reconciled, compare results with the closest peer group available. Label differences in cohort size, dates, and expense scope instead of hiding them.
Review CAC Decisions Across Teams

CAC affects marketing, sales, finance, customer success, delivery, pricing, and leadership, so no single dashboard owner should interpret the result alone.
Use a cross-functional review to reconcile sources, explain differences, challenge assumptions, and assign the next action without hiding uncertainty.
Review the result with the operating team
Review monthly for campaign operations and quarterly for management decisions, adjusting cadence to deal volume. Small cohorts need longer windows and wider uncertainty bounds.
Ask sales whether leads became qualified opportunities, whether deals reached expected ACV, and which obstacles delayed conversion.
Use a cross-functional review
Ask finance whether the cost allocation, gross margin, customer start date, and collections assumptions remain valid.
Marketing can explain whether audience quality, creative, tracking, landing pages, and channel mix changed during the cohort period.
Record decisions and next steps
For business-level value measurement, keep CAC analysis connected to the CRM investment ROI framework, while preserving the original campaign cohort data.
Preserve the approved range, evidence, assumptions, limitations, owner, review date, and action so later teams can understand why spending changed.
Record these outputs after every CAC review:
- Approved range and confidence level
- Reconciled sources and unresolved gaps
- Budget, pause, or test decision
- Owner and next review date
Share the decision with channel owners and preserve the prior range so future reviews can explain why acquisition policy changed.
Keep the approved evidence accessible for later comparison.
FAQ
These answers clarify common B2B SaaS CAC questions involving targets, cost scope, payback, creative expense, refresh cadence, channels, salaries, prepayment, samples, and scaling decisions.
What is a good CAC for B2B SaaS?
There is no universal dollar target. Compare your fully loaded CAC and payback with similar ACV, gross margin, retention, stage, and sales motion.
Is paid media CAC the same as fully loaded CAC?
No. Paid media CAC includes the media costs you define for a channel. Fully loaded CAC also allocates the acquisition costs required to win customers.
How do I calculate CAC payback?
Divide fully loaded CAC by monthly gross profit per new customer. Use consistent cohort values and account for billing timing, onboarding, churn, and collections.
Should agency and creative costs be included?
Include costs that directly support acquisition in the measure you report, and state how they are allocated. Keep media-only and fully loaded views separate.
How often should we refresh CAC benchmarks?
Review operating cohorts monthly when volume permits and planning assumptions quarterly. Refresh sooner when pricing, margin, sales motion, attribution, or major costs change.
How should CAC be compared across channels?
Use consistent cost boundaries, attribution windows, customer definitions, and cohort dates. Separate channel CAC from blended and fully loaded business CAC.
Compare customer quality as well as acquisition cost. A lower CAC can be misleading when the channel produces smaller contracts, weaker retention, or slower collections.
Should sales salaries be included in CAC?
Include sales compensation and related acquisition costs in a fully loaded CAC view. Keep a separate media-only measure for campaign optimization.
Document allocation rules for shared teams and tools. Consistent definitions matter more than forcing every stakeholder to use one metric for every decision.
How does annual prepayment affect CAC payback?
Annual prepayment can improve cash recovery, but CAC payback based on gross profit should still reflect revenue recognition, margin, churn risk, and collection timing.
Report the chosen method clearly. Cash payback and gross-margin payback answer different planning questions and should not be presented as interchangeable.
What sample size makes a CAC benchmark useful?
No single threshold fits every sales cycle. Show customer count, spend, observation window, and uncertainty whenever a small cohort could distort the result.
Combine adjacent periods only when pricing, channel mix, sales motion, and definitions remain comparable. Preserve the original cohort data for later reconciliation.
When should a company stop scaling ad spend?
Pause expansion when marginal CAC, payback, lead quality, conversion capacity, retention, or cash constraints move outside the approved operating range.
Investigate the cause before cutting every campaign. Saturation, tracking changes, sales bottlenecks, audience quality, and pricing can produce similar headline symptoms.
Conclusion
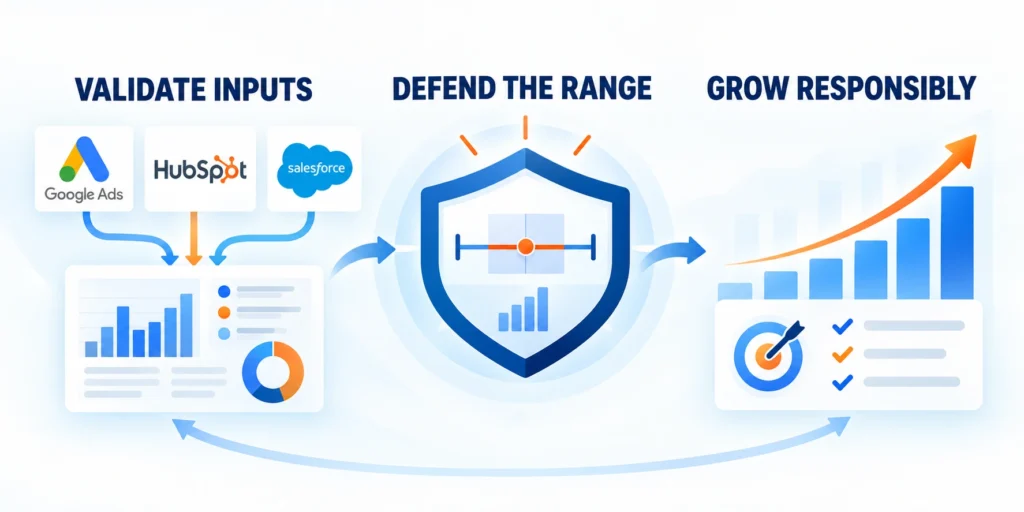
A good B2B SaaS CAC is a defensible range connected to gross margin, retention, expansion, sales motion, cash timing, acquisition capacity, and the company’s strategic constraints.
External benchmarks provide context, but reconciled company cohorts should determine whether current spending creates customers with acceptable economics and manageable risk.
Build the range from consistent definitions
Define included costs, qualified customers, cohort dates, attribution, revenue recognition, gross margin, retention, and payback timing before comparing channels or periods.
Separate media CAC from fully loaded CAC and keep leading funnel signals distinct from acquired-customer economics.
Require these inputs before approving a CAC range:
- Reconciled spend and loaded cost scope
- Qualified customer cohort and acquisition period
- Gross margin and payment timing
- Retention and expansion evidence
- Documented attribution and exclusions
Connect CAC limits to demand generation
Translate the company ceiling into channel tests using observed conversion, sales capacity, evidence lag, creative cost, qualification standards, and lower-case scenarios.
Scale only after customer outcomes mature enough to support the decision, not because a platform reports inexpensive leads or temporary conversion volume.
Review these outcomes before increasing acquisition spend:
- Qualified customers reconcile across systems
- Gross-margin payback remains acceptable
- Sales and delivery capacity support growth
- Retention does not weaken by cohort
- Stop rules and owners remain active
Refresh the range when pricing, product mix, sales motion, channel mix, staffing, margin, retention, payment terms, attribution, or market conditions materially change.
The objective is not one universal CAC number. It is a repeatable decision process that protects growth, cash, customer quality, and operating discipline.








Leave a Reply