


What Predictive Analytics Can and Cannot Do in B2B Marketing
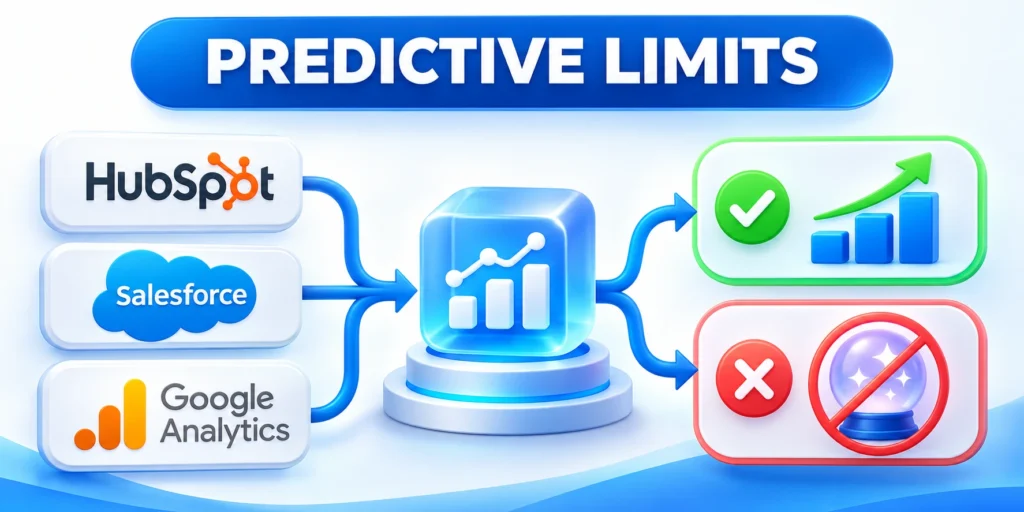
Predictive analytics in B2B marketing uses historical and current data to estimate what may happen next, such as which accounts are more likely to engage or convert.
It can help teams prioritize attention, but a score is an estimate rather than a fact about a buyer.
Use predictions to support a specific marketing decision
A useful prediction changes a defined action: which account receives outreach, which message is tested, or when a customer receives support.
It should improve a decision that already has an owner, a process, and a way to measure the result.
Predictions can support these practical marketing decisions:
- Estimate account fit for a defined offer.
- Prioritize leads for a human review.
- Identify customers who may need renewal support.
- Suggest the next content or product interaction to test.
Separate prediction from explanation and causation
A model can identify patterns without proving why they occur. A high score does not show that an ad, email, or sales action caused a purchase.
Use experiments or stronger causal methods when the question is whether an intervention created incremental impact.
Example: predict account readiness without claiming intent
Suppose a software company wants to prioritize accounts for a new integration campaign. It defines success as a qualified opportunity opened within 60 days.
The score estimates similarity to past accounts meeting that definition. It does not prove that a specific contact wants to buy.
The pilot should preserve these decision safeguards:
- Marketing sends the top 50 eligible accounts to sales for review.
- Sales records whether each account was relevant and why.
- A holdout group helps test whether outreach changes outcomes.
- The team reviews false alarms before expanding the audience.
Start with a Decision, Not a Model

Choose the business decision first, then determine whether a prediction can make that decision more consistent or timely.
Starting with a model often produces a score that no team knows how to use.
Write a decision brief before collecting data
A useful decision brief records these operating choices:
- Decision: what action will the team take?
- Unit: is the prediction about an account, contact, opportunity, or customer?
- Outcome: what event counts as success, and within what time window?
- Owner: who acts on the result and how quickly?
- Baseline: how does the team make this decision today?
- Guardrail: what action should never be automated from this score alone?
For example, define whether “conversion” means a qualified opportunity created within 90 days, a closed deal, or a renewal.
Changing that definition changes the dataset, prediction horizon, and business value being estimated.
Check whether a simpler method already works
Compare a predictive approach with current rules, a simple baseline, and human judgment.
If a small rule set already produces useful, explainable results, a complex model may add cost without improving decisions.
Set a baseline that reflects today’s process
Record how the team currently selects accounts, including rules, review time, and the outcomes it can measure.
Then compare the model with that process on the same later time period and the same eligible population.
Compare the candidate against these practical baselines:
- Baseline A: existing manual prioritization.
- Baseline B: a transparent rule, such as recent product use plus firmographic fit.
- Candidate: the predictive ranking under evaluation.
If the candidate does not improve useful outcomes or reduce work, keep the simpler approach and revisit the use case.
Prepare Data That Represents Buying Behavior

Data preparation often determines whether a prediction reflects buying behavior or merely records of how the company collects information.
Align data around the decision unit, outcome definition, and prediction date before creating features.
Create a time-aware analysis table
For each account or opportunity, create a snapshot using only information available at the date when the team would have made the decision.
Apply these data controls before building each snapshot:
- Use stable account identifiers across CRM, marketing automation, and product systems.
- Normalize event dates, time zones, lifecycle stages, and source definitions.
- Document missing values, duplicate records, and changes in tracking.
- Keep outcome dates separate from information available before those outcomes.
This time boundary prevents data leakage, where the model accidentally sees signals created after the prediction moment.
Use relevant signals with appropriate boundaries
Candidate signals may include recent product activity, account fit, engagement with relevant material, or prior stage progression.
Check whether each field is available, reliable, permitted for the intended purpose, and understandable to the team.
Limit signals to evidence the team can use fairly
Do not assume that more data improves a model. Unreliable tracking or sensitive attributes can create misleading or inappropriate outcomes.
Exclude a signal when its permitted use, business meaning, collection quality, or decision-time availability cannot be defended.
Document each feature before it enters the model
Write down what a feature measures, its source, refresh schedule, missing-value handling, and whether it is available at decision time.
For an engagement signal, distinguish a human visit from an automated email-security scan when the tracking platform supports that distinction.
Document every candidate signal through these controls:
- Use a consistent lookback window, such as activity during the previous 30 days.
- Count meaningful events rather than treating every page view as equal.
- Keep a signal dictionary with owner, definition, and known limitations.
- Remove fields the organization cannot explain or appropriately use.
Choose a Method That Fits the Use Case
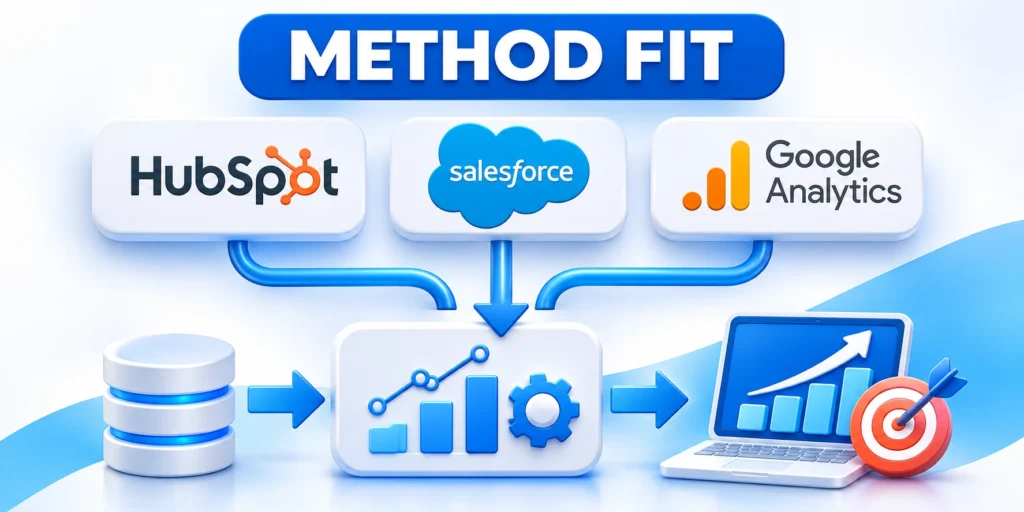
Different marketing decisions require different targets and evaluation methods.
Do not rank techniques by novelty; choose the simplest method that answers the question and can be maintained.
| Use case | Possible target | Operational question |
|---|---|---|
| Lead prioritization | Qualified opportunity within a defined period | Which leads need review first? |
| Account propensity | Response or purchase event by account | Which accounts fit this campaign? |
| Customer retention | Renewal, expansion, or cancellation event | Who needs timely human support? |
| Next action | Engagement with a specific recommended step | Which action is useful to test next? |
Match the output to the team’s workflow
A ranked list may be enough for a sales team that reviews accounts weekly. A campaign platform may need a stable segment and an explanation of how often it refreshes.
For smaller datasets, a transparent scoring rule or regularized model can be easier to validate than an elaborate architecture.
Choose the right prediction horizon
A short horizon can support immediate follow-up; a longer horizon may better fit enterprise buying cycles but can be harder to validate quickly.
Set the horizon based on the decision and sales cycle, then keep it consistent when comparing model results.
Use a practical comparison before selecting a model
A propensity model ranks accounts by the estimated likelihood of a defined event. A classifier can assign a category, such as likely or unlikely.
Forecasting estimates a quantity over time, while clustering groups records without a labeled outcome. These methods answer different questions.
Match the method to these operational questions:
- Need a ranked sales queue? Compare ranking quality near the team’s review capacity.
- Need a volume estimate? Compare forecast error across the planning horizon.
- Need audience discovery? Treat clusters as exploratory until a useful action is validated.
- Need a likely/unlikely flag? Define the decision threshold and error costs first.
Test Performance Before Acting on Predictions

Evaluate predictions on data that was not used to fit the model, preserving time order when marketing decisions depend on future behavior.
Report performance in terms that reflect the cost of misses, false alarms, and limited team capacity.
Use a validation plan that resembles deployment
Validate performance through this deployment-like sequence:
- Split records by time or account group to prevent overlap.
- Fit and tune the model using only the training data.
- Choose a threshold using business capacity and error costs.
- Evaluate once on a later holdout period.
- Compare results against the existing process and a simple baseline.
Random splits can overstate performance when future events, the same accounts, or duplicated contacts leak across both sets.
For a ranked queue, inspect precision among the records the team can actually review, not only an overall score.
Choose a threshold from capacity and error costs
Imagine sales can review 40 accounts each week. A threshold should produce a manageable queue rather than simply maximize a statistical score.
Estimate the cost of missing a promising account and the cost of sending an irrelevant account for review.
Set the operating threshold through these checks:
- Review the top 40 and record how many meet the agreed outcome.
- Compare that share with the current process and a simple rule.
- Check whether response time and workload remain practical.
- Adjust only after documenting why the new threshold is preferable.
Measure calibration and segment differences
Check whether predicted probabilities correspond to observed outcomes across useful score ranges.
Review performance by segment, channel, company size, and lifecycle stage when sample sizes support a fair comparison.
Use these actions to measure calibration and segment differences:
- Investigate sharp differences before deployment.
- Check smaller groups separately; aggregate scores can hide poor performance in important segments.
- Validate unusual segments with domain experts before changing operations.
Put Predictions into Campaigns and CRM Workflows
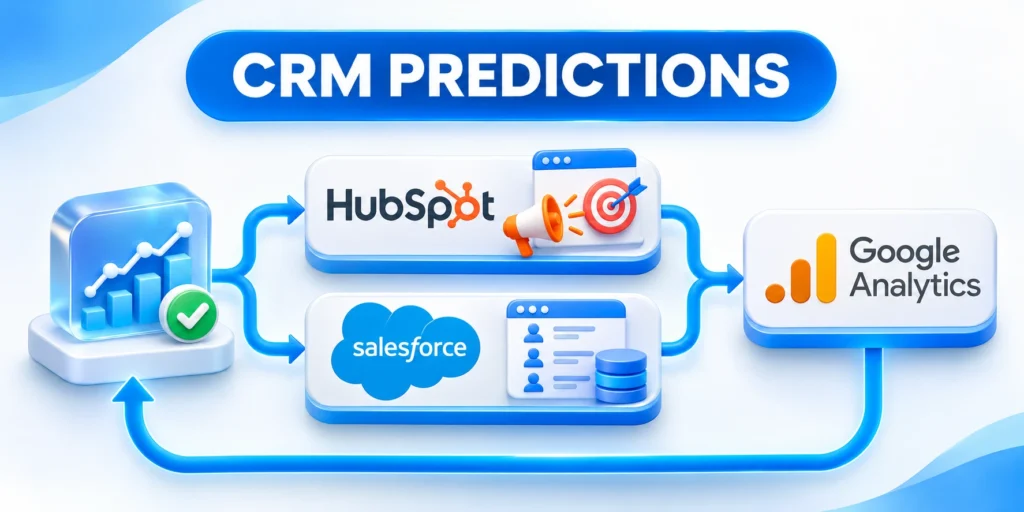
A useful model needs a controlled path from prediction to action, feedback, and review.
Start with recommendations for a human owner before automating decisions that affect customers.
Pilot a narrow audience and clear action
Choose one campaign, region, or sales team. Define who receives the score, how it appears, and what response is expected.
Protect the pilot through these operating guardrails:
- Show the score with a timestamp and a short explanation.
- Give owners a way to record whether the recommendation was useful.
- Do not suppress a qualified account solely because its score is low.
- Maintain a control group when measuring incremental campaign impact.
For example, route a daily top-ranked account list to an owner for review instead of immediately launching personalized outreach.
Use a small, time-boxed pilot
A four-week pilot can test whether the data arrives on time, owners understand the score, and the handoff fits existing work.
Follow this sequence to use a small time-boxed pilot:
- Week 1: confirm eligibility rules, owners, data freshness, and the baseline.
- Week 2: send a limited list for human review and capture feedback.
- Third week: compare actions and response times with the normal workflow.
- Week 4: review outcomes, workload, errors, and the decision to continue.
Do not claim campaign lift from a simple before-and-after comparison if seasonality or other changes could explain the difference.
Document Prediction Delivery and CRM Ownership

Record the model version, score time, target, and campaign action in the systems used by marketing and sales.
Set a fallback process for missing scores, late data, or a model service outage.
Connect each score through these workflow decisions:
- For measurement context, use the site’s guide to measuring ROI in long B2B sales cycles.
- Define the campaign decision that each prediction supports.
- Monitor downstream sales outcomes after automation changes.
Define a score delivery contract
Specify the delivery schedule, accepted delay, expiration window, owner, and fallback so every destination interprets a score consistently across CRM, automation, analytics, reporting, and regional operations teams.
Document how consent, access controls, source changes, and model versions affect eligibility before connecting another campaign or sales queue to production systems with clearly named accountable owners.
Keep the CRM record actionable
Store only fields needed for the workflow: score, score date, model or rule version, and a concise reason code when available.
Define what happens when the score expires. A stale prediction should not remain in a queue as if it were current.
Keep the CRM record actionable through these controls:
- Make the owner and next action visible.
- Give users a way to flag incorrect or unusable recommendations.
- Keep source data and access controls aligned with company policy.
- Route missing or expired scores to the normal prioritization process.
Govern, Monitor, and Measure Business Impact

Predictions can become less useful when buying patterns, campaigns, products, or tracking change.
Assign an owner for monitoring, access, documentation, and decisions about retraining or retirement.
Track model quality and business outcomes
Monitor model quality alongside these business outcomes:
- Data freshness, missing fields, and score coverage.
- Ranking quality or probability calibration over time.
- Qualified pipeline, conversion, retention, or another chosen outcome.
- Workload, override rates, complaints, and customer impact.
- Performance compared with a baseline or controlled test.
Separate model quality from business impact. A useful prediction can fail to improve results if the workflow is slow or the offer is unsuitable.
Review both layers together so teams can distinguish a weak model from poor delivery, capacity constraints, or an irrelevant campaign.
Set review triggers and a safe fallback
Define review triggers such as material data changes, sustained score shifts, lower performance, or a change in the marketing decision.
Keep a documented fallback to the prior process while the owner investigates. Do not retrain automatically without checking data quality and evaluation results.
Protect deployment through these governance controls:
- Limit score access to people who need it for the documented decision.
- Set retention and privacy controls for the data used.
- Review whether the decision could disadvantage a group before automating it.
Monitor the decision workflow, not only the model
Record whether users saw the score, understood the recommended action, followed it, overrode it, or received the prediction too late to respond.
A stable model can still produce no value when ownership is unclear, response capacity is limited, or the suggested action does not fit the account.
Monitor the complete decision workflow through these signals:
- Track score availability and delivery time.
- Measure accepted, rejected, and ignored recommendations.
- Capture a reason for consequential overrides.
- Compare response time with the previous workflow.
- Review workload by team and segment.
Use override reasons to investigate the system, not to punish users. Repeated overrides may reveal missing data, unclear guidance, or a changed business rule.
When capacity is constrained, test whether prioritization improves the use of available time. Do not claim impact from a score that nobody could act upon.
Audit Outcomes and Control the Model Lifecycle
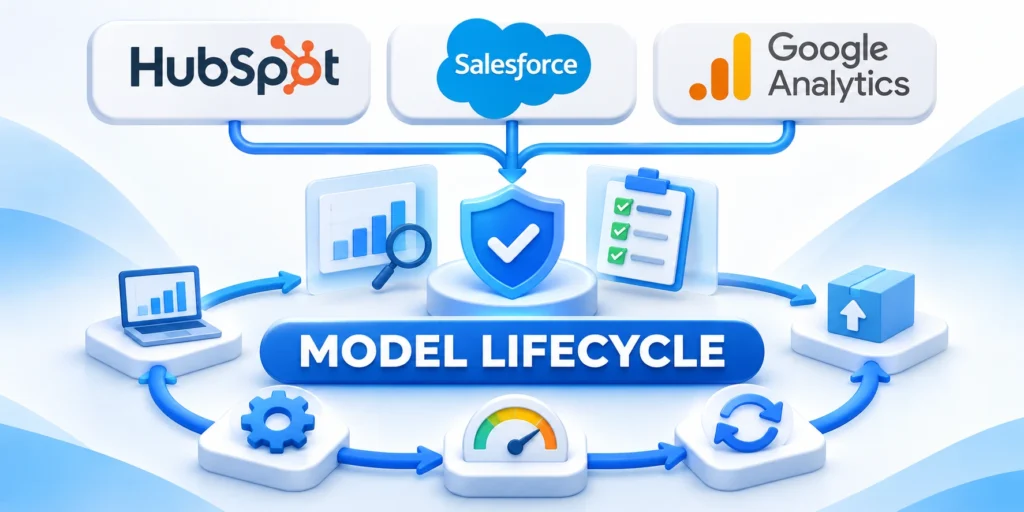
Aggregate performance can hide poor results for a region, account tier, product line, acquisition source, or customer group with different buying behavior.
Choose segments before reviewing results when possible. Post-hoc slicing can produce misleading patterns, especially when each group contains few outcomes.
Audit meaningful segments through this controlled sequence:
- Confirm the segment has a business reason.
- Check sample size and outcome frequency.
- Compare calibration, ranking, and action rates.
- Review downstream business outcomes and complaints.
- Document limitations before expanding automation.
If one segment performs poorly, pause or narrow its use while investigating data coverage, label definitions, process differences, and possible access or fairness concerns.
Retain the normal workflow as a fallback until the corrected model and process pass the same validation used for the initial pilot.
Plan retraining, rollback, and retirement
Retraining is a controlled release, not routine maintenance. Version the data window, features, labels, evaluation results, approval, deployment date, and rollback path.
Compare the candidate with the current model and a simple baseline. Improvement on one metric does not justify worse calibration, stability, or business outcomes.
Control retraining, rollback, and retirement through these steps:
- Preserve the current production version.
- Test the candidate on time-separated data.
- Review segment and workflow effects.
- Approve deployment and rollback criteria.
- Monitor the release against expectations.
Retire the model when the decision disappears, reliable data is unavailable, maintenance exceeds its value, or a simpler rule performs comparably with lower risk.
Document retirement and remove dependent automations carefully. Stale scores should not remain visible after their assumptions or permitted use have expired.
FAQ
These answers clarify common decisions about predictive models, marketing workflows, baselines, monitoring, and safe operational use.
What is predictive analytics in B2B marketing?
It uses data to estimate future outcomes that may help teams prioritize accounts, leads, campaigns, or customer support.
Does a high score mean an account will buy?
No. A score estimates a defined outcome and time window; it does not guarantee a purchase or explain its cause.
How much data does a model need?
It depends on outcome frequency, data quality, and variation. Compare against a simple baseline before deciding the data is sufficient.
Should marketing automate actions from a prediction?
Begin with human review for consequential actions. Automate only after reliable performance, clear guardrails, and a fallback are established.
How often should a predictive model be reviewed?
Set a regular monitoring cadence and additional reviews when data, products, campaigns, or outcomes materially change.
What is a useful baseline for predictive marketing?
Use the current process or a simple transparent rule that addresses the same decision. The model should demonstrate practical improvement against that comparison.
How should teams handle missing prediction data?
Route missing or expired scores to a documented fallback. Do not treat absent data as low intent or automatically exclude the account.
Can predictive analytics replace marketing judgment?
No. Predictions estimate defined outcomes from available data. Teams still decide objectives, evidence standards, actions, guardrails, and when the model should not apply.
What should trigger a model rollback?
Rollback when data quality fails, performance drops materially, workflow harm appears, or the model operates outside its approved decision and population.
When should a predictive model be retired?
Retire it when the decision changes, required data is unavailable, maintenance exceeds value, or a simpler approach performs comparably with lower risk.
Conclusion

Predictive analytics can improve B2B marketing decisions when a defined score connects to an accountable action and measurable outcome.
The model remains decision support; it does not prove buyer intent, explain causation, or replace responsible marketing judgment.
Build the operating decision before the model
Define the unit, target, prediction horizon, owner, response capacity, baseline, and prohibited actions before collecting candidate signals.
That decision brief keeps analysis aligned with a business need and exposes cases where a transparent rule already works.
A responsible predictive workflow includes these essential controls:
- Time-aware data with documented signal definitions.
- A simple baseline and deployment-like validation.
- Human review during a narrow initial pilot.
- Visible ownership, timestamps, and fallback processes.
- Monitoring across outcomes, segments, and workflow behavior.
Expand only after proving practical value
Compare qualified outcomes, workload, overrides, response time, and customer impact with the existing process before increasing automation.
Preserve rollback and retirement paths because data, campaigns, buying behavior, and permitted uses can change after deployment.
Connect predictions to the wider AI strategy
Predictive models should share governance, measurement, documentation, and human-accountability standards with other marketing automation systems.
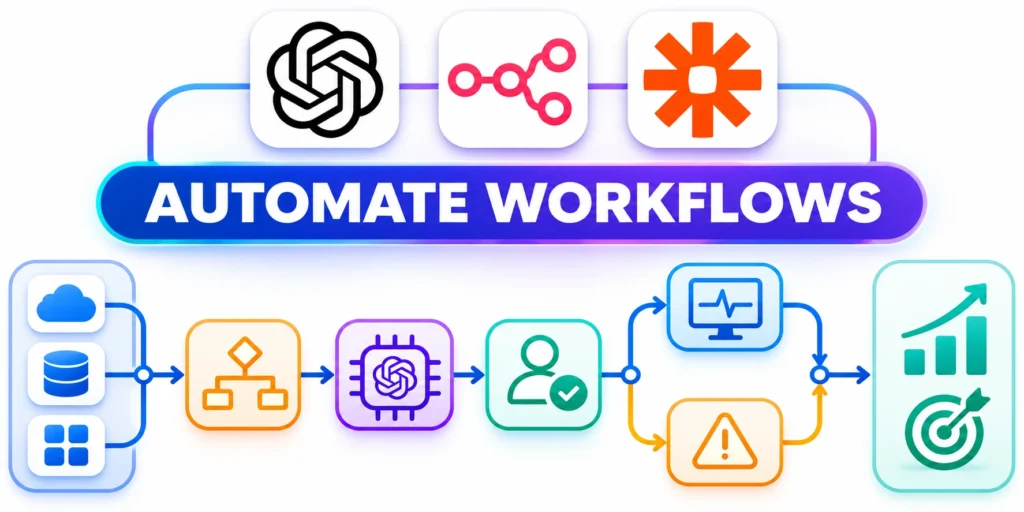
For the broader framework, read AI in B2B Marketing: Automating Workflows and Analytics.
Review the decision, not only the score
A stable score can still fail when ownership, capacity, messaging, or the surrounding campaign changes.
Keep evaluation tied to the complete workflow and the customer outcome the decision was designed to support.


Leave a Reply