


Why Database Work Becomes a Bottleneck

A busy WordPress portal can slow down even when its pages, images, and web server appear healthy. WordPress database optimization starts by measuring the wait.
Optimization starts by finding that cause. Changing tables or adding indexes without evidence can increase write costs and create operational risk.
Recognize database symptoms without guessing
Look for slow admin screens, delayed search results, timeouts during imports, and requests that become slower as concurrency rises.
Those symptoms do not prove that MySQL is the bottleneck. Busy application workers, remote service calls, object storage, and network latency can produce similar behavior.
Key considerations for recognize database symptoms without guessing include:
- Compare database time with total request time using the same pages and traffic window.
- Separate slow read-heavy pages from write-heavy actions such as checkout, publishing, and form submissions.
- Check whether the slowdown affects all requests or only one plugin feature or endpoint.
Database latency is only one part of delivery. For front-end signals such as layout shifts and interaction delay, see our Core Web Vitals guide for large B2B WordPress sites.
Understand what WordPress asks the database to do
WordPress stores posts, metadata, users, settings, and plugin records in relational tables. Plugins and themes add queries during page generation.
High traffic multiplies repeated work. A query that takes only a few milliseconds may still matter when hundreds of requests execute it concurrently.
Connect concurrency to repeated query cost
A useful diagnosis ties a measurable delay to a query pattern and its caller. It does not begin with a blanket database-cleaning plugin or a guessed index.
Estimate cumulative cost by multiplying representative execution time by frequency during the same traffic window. This exposes small queries that become expensive under concurrency.
Establish a Baseline Before Changing Tables
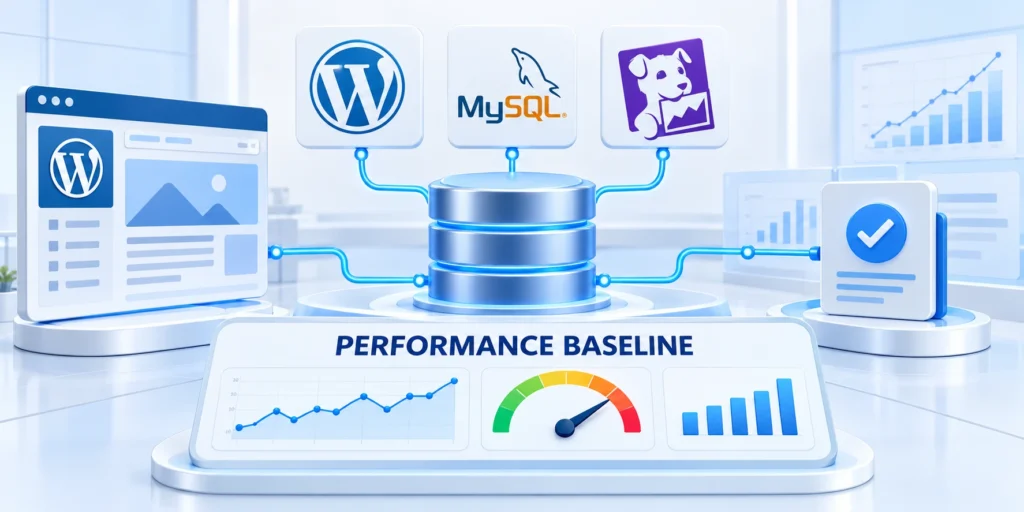
Record how the portal behaves before tuning. A baseline lets the team distinguish a real improvement from a traffic change or an unrelated deployment.
Use a representative period that includes ordinary traffic and a known busy interval. Keep the same routes, test accounts, and measurement method when comparing results.
Measure the same workload each time
Track response percentiles, request volume, database CPU, active connections, slow-query count, and error rate. Record the time range and recent deployments.
Median latency can hide a small group of very slow requests. Compare p95 or p99 response times when the hosting platform exposes them consistently.
Keep the comparison conditions consistent
Record whether page cache, object cache, CDN, and scheduled jobs were active during each sample. These conditions can change database work without any schema change.
Compare the same routes and traffic windows after each intervention. If traffic differs sharply, label the result inconclusive instead of claiming a database improvement.
Compare cache states without stressing production
For a controlled check, compare the same page with a warm cache and a cold cache. Do not send repeated load tests to a production site without approval.
Keep these baseline conditions consistent:
- Representative routes and authenticated states.
- Traffic window and request volume.
- Page, object, and CDN cache state.
- Scheduled jobs and recent deployments.
- Database engine and connection limits.
Repeat the comparison after one intervention. If workload or cache conditions differ materially, label the result inconclusive and collect another controlled sample.
| Signal | Baseline measure | Compare after change |
|---|---|---|
| Request latency | p50, p95, and p99 | Same routes and window |
| Database cost | Query time and count | Same request sample |
| Reliability | Errors and timeouts | No regression accepted |
| Capacity | CPU and connections | Peak and sustained load |
Collect Safe Database Facts

Start with read-only measurements from the host dashboard or an authorized database console. Avoid changing server variables when prior values cannot be restored.
Collect enough context to reproduce the finding without exposing secrets, customer records, complete query parameters, or unrestricted database access.
Capture a bounded diagnostic snapshot
Record the database engine, version, storage, large tables, active connections, CPU, slow-query count, backup schedule, and observation window.
Use these facts in each diagnostic snapshot:
- Exact observation window and traffic conditions.
- Database engine, version, and hosting limits.
- Large tables with identified owners.
- Connections, resource use, and slow-query count.
- Recent deployments, imports, and scheduled jobs.
Prefer aggregated fingerprints and identifiers when evidence must be shared. Restrict raw logs to authorized operators under the applicable retention process.
Use WP-CLI only within authorized access
The following read-only command reports database size when executed from the WordPress installation directory with appropriate credentials.
wp db sizeIf WP-CLI is unavailable, request equivalent read-only metrics from the host. Do not bypass platform controls merely to reproduce the command.
Interpret the report against the workload
Database size alone does not identify a slow query. Compare table growth, query fingerprints, traffic, scheduled work, and request latency during the same interval.
A large table may be healthy while a smaller table suffers inefficient scans. Choose the next investigation from measured query cost and business impact.
Find Slow Queries and Their Callers

Slow-query evidence narrows the work to statements that consume meaningful time or repeat frequently. Pair each statement with the WordPress component that issued it.
Database logs can expose query text and operational details. Limit access, choose a short diagnostic window, and follow the host’s retention rules.
Use slow-query logs as a bounded investigation
Ask the hosting provider whether the MySQL slow-query log is available and how to enable it safely. Set a useful duration threshold instead of logging every statement.
Record the start and end time, the threshold, and the traffic conditions. Disable temporary logging after collection if it is not part of the normal operations plan.
Prioritize queries by cumulative time
Sort findings by total time and frequency, not only by the slowest single execution. One moderately slow query repeated thousands of times may deserve attention first.
Group equivalent statements by fingerprint so changing parameter values do not hide a repeated pattern. Then compare its cumulative cost across representative traffic windows.
Trace statements to plugin and theme code
In staging, Query Monitor can help connect database queries to callers and request context. Use the official Query Monitor plugin page to review its current details.
Install diagnostic tooling only for the investigation, restrict access to administrators, and remove or disable it when the work is complete.
Key considerations for trace statements to plugin and include:
- Capture the request URL, query fingerprint, caller, and observed duration.
- Check whether the query repeats across several components in the same request.
- Reproduce the request with realistic data in staging before editing the responsible code.
Read an execution plan carefully
MySQL EXPLAIN describes how a query may access tables, apply indexes, and join rows. Review the plan with a database engineer when the query affects critical transactions.
Inspect access type, estimated rows, selected indexes, join order, sorting, and temporary work together. No single plan field proves that a change is safe.
EXPLAIN
SELECT ID, post_title
FROM wp_posts
WHERE post_status = 'publish'
  AND post_type = 'post'
ORDER BY post_date DESC
LIMIT 20;
Adapt the example to an observed query
This example illustrates inspection only. Replace the table prefix with the site’s actual prefix and use the exact query pattern observed in logs.
EXPLAIN ANALYZE executes a query to collect actual timing. Use it only for a safe statement and controlled data, preferably in staging.
Reduce Repeated Database Reads with Caching

Caching can reduce repeated reads when the same data is requested often and changes infrequently. It complements database tuning; it does not repair every inefficient query.
Choose a cache layer that matches the measured bottleneck. Page cache, object cache, and browser cache store different kinds of results.
Choose page cache or persistent object cache by workload
Page caching can serve public pages without rebuilding their WordPress queries. It is less applicable to personalized pages, shopping carts, and account-specific responses.
A persistent object cache stores selected WordPress objects across requests. WordPress’s default object cache is request-scoped unless a persistent backend is configured.
Confirm cache backend support with the host
Before choosing a backend, confirm that the host provides its service, supported language extension, memory limits, and a compatible WordPress drop-in or plugin.
Record who owns availability, eviction policy, monitoring, upgrades, and recovery. A cache dependency needs an operating model, not only an activation switch.
Test cache behavior and invalidation
Test public pages, logged-in views, search, publishing, and any commerce flow that depends on current data. Verify the response remains correct after content changes.
Follow this sequence to test cache behavior and invalidation:
- Record the baseline response time and database-query count for a representative route.
- Enable one cache layer in staging and confirm that repeated requests use the intended cache.
- Update a post and verify that cached pages refresh without exposing stale private data.
- Compare the same workload against baseline, then document a rollback step.
Object-cache invalidation must match how the application updates its data. If stale output appears, identify the cache key or purge rule before extending expiration times.
Diagnose Cache Misses Before Increasing Capacity

A low cache hit rate may reflect changing data, ineffective keys, premature eviction, or an application path that bypasses the configured cache.
Measure miss patterns before adding memory because greater capacity cannot correct unsuitable object selection, inconsistent keys, or broken invalidation.
Segment misses by route and object type
Compare public, authenticated, search, editorial, API, and scheduled workloads separately. Their data changes and eligibility for caching differ materially.
Review these signals before changing capacity:
- Hit rate by route and object group.
- Evictions, memory use, and item size.
- Key lifetime and invalidation frequency.
- Fallback behavior during backend unavailability.
- Correctness validation after content and account changes.
Check eviction and memory metrics with the hosting provider. A larger cache wastes resources when the application immediately invalidates or bypasses stored objects.
Test one cache hypothesis at a time
Select one high-cost route and state whether misses should decline after a key, lifetime, object-selection, or invalidation change.
Run the same representative requests in staging, verify current data after updates, and compare database work, latency, errors, and memory against baseline.
Plan safe behavior when cache fails
A persistent cache is a dependency. Confirm timeouts, fallback, monitoring, ownership, and recovery before directing critical traffic through it.
Test a controlled outage outside production. The application should avoid exposing private data, overwhelming MySQL, or remaining silently stale after service recovery.
Review WordPress Data and Cleanup Candidates

A large database is not automatically a slow database. Table size matters when it affects storage, backups, maintenance windows, or a measured query path.
Review the records a specific feature owns before cleanup. Plugin tables can contain audit history, queued work, or data required to restore business operations.
Inventory before deleting anything
List large tables, their owners, growth rate, and retention purpose. Ask the responsible plugin vendor when a table’s meaning or deletion behavior is unclear.
Potential candidates may include expired transients, redundant revisions, or orphaned metadata. Confirm expiration and ownership rather than treating every old row as disposable.
Estimate cleanup scope before deletion
Review the proposed row count in a dry run. Before deleting records, verify a recoverable backup using the WordPress backup and recovery protocol.
Estimate backup duration, deletion time, lock exposure, storage recovered, and expected query benefit. Cancel cleanup when the operational gain remains unclear.
Use a reversible cleanup process
Follow this sequence to use a reversible cleanup process:
- Export a verified backup and confirm the restore procedure on a separate environment.
- Disable the cleanup schedule and run a report-only query to identify rows and table ownership.
- Remove a small approved set in staging; test publishing, search, login, and affected plugins.
- Schedule production work in a quiet window; compare errors, query time, and table growth afterward.
When a cleanup offers no measurable operational benefit, keep the data. Maintenance adds risk and should solve a defined storage, backup, or query problem.
After an approved cleanup, verify affected features and compare table growth, backup duration, errors, and representative query behavior against the recorded baseline.
Set retention rules with the data owner
Agree how long logs, revisions, and plugin records must remain available for support, audit, or recovery. Document the owner and approval for each rule.
Schedule cleanup only after confirming retention requirements and restore behavior. Recheck growth after the first run before making it recurring.
Plan Index and Table Maintenance Safely

An index can reduce the rows MySQL must examine, but each index consumes storage and adds work to inserts and updates. Measure both sides.
Index changes should follow a query plan and the exact production query pattern. Do not add columns to core tables based only on a generic tuning checklist.
Evaluate one index against a real query
Review the filter and sort columns shown in the observed query. Ask a database engineer to assess cardinality, composite-index order, existing indexes, and write volume.
Evaluate these factors before proposing an index:
- Observed filters, joins, and sort columns.
- Column cardinality and data distribution.
- Existing indexes and composite order.
- Read frequency and cumulative query cost.
- Write volume, storage, and maintenance impact.
In staging, compare the execution plan and representative query time before and after a single change. Include write-heavy operations in the same evaluation.
Keep index changes reversible
Remove an index only after confirming that another query does not depend on it. Retain a record of the original definition and the rollback command.
Test creation and removal against realistic data volumes because either operation may consume resources, wait on locks, or affect replication and backups.
Treat table optimization as maintenance, not query repair
WP-CLI provides a database optimization command that delegates to database tooling. Confirm engine support and host guidance before running it.
Table optimization may reorganize storage, but it cannot repair application logic, missing cache boundaries, or a query pattern that reads unnecessary rows repeatedly.
wp db optimizeProtect production during table maintenance
Take a verified backup, test the command on staging, and schedule production during a maintenance window. Do not assume it will fix a slow application query.
WP-CLI’s database optimization documentation explains the operation and options. Confirm the active database engine and permissions with the hosting provider first.
Build a Staged Optimization Runbook

A runbook converts the diagnosis into an authorized, reversible change with named owners, measurable success, and explicit rollback triggers.
Keep one intervention per runbook so the team can attribute results and reverse the change without untangling unrelated deployments.
Sequence one evidence-based database change
Begin with the symptom, affected route, baseline window, responsible query or table, and caller. State the evidence connecting them.
Follow this sequence for a controlled change:
- Document the symptom and baseline metrics.
- Identify the caller and measured cause.
- Select one bounded intervention.
- Back up and test in staging.
- Verify correctness and representative load.
- Roll out during a monitored window.
- Compare results and revert when required.
Record dependencies, permissions, maintenance timing, communication, expected duration, validation steps, and the person authorized to stop the rollout.
Define success and rollback before rollout
Set a measurable goal, such as lower p95 latency on a named route without increased errors, unacceptable write cost, or broken business behavior.
Keep the previous configuration, index definition, cache settings, operator commands, and restoration instructions available throughout the monitored window.
Record the result and operational decision
After rollout, capture the same workload, metrics, correctness checks, timestamps, operator, and affected routes. Explain whether the hypothesis was supported.
If the intervention fails its threshold or introduces harm, revert it and return to the evidence. Preserve the result to prevent repeated ineffective work.
Conclusion

Reliable database optimization is a cycle: measure a real bottleneck, make a targeted change, and confirm both performance and correctness afterward.
Keep cleanup, caching, query changes, and index work tied to evidence. Protect production with backups, staging, an owner, and a practical rollback path.
Keep the next action small and measurable
Start with the request that consumes the most total database time. Trace its caller, test one appropriate intervention, and compare the same route after rollout.
When the measurements point elsewhere, address that layer instead. A disciplined diagnosis saves maintenance effort and protects the portal’s data.
Roll out a database change with controlled exposure
Schedule the change when the accountable application, database, and business owners can observe it. Avoid combining unrelated plugin, infrastructure, or content changes in the same window.
Record the starting metrics immediately before rollout. Include representative request latency, query time, error rate, database load, cache behavior, and completion of the affected business journey.
Key considerations for roll out a database change include:
- Confirm the backup and restoration procedure.
- Identify the exact change and owner.
- State success and rollback thresholds.
- Keep the previous configuration available.
Apply the smallest change that tests the hypothesis. If possible, expose it to a controlled share of traffic or one workload before expanding across the portal.
Compare the same routes and query patterns after rollout. A lower average can hide slower tail requests, new write cost, or errors affecting a smaller segment.
Plan capacity from measured workload growth
Optimization cannot replace capacity planning. Track how content volume, search behavior, logged-in traffic, integrations, and scheduled jobs change the number and cost of database operations.
Use peak and sustained workloads, not a single quiet test. Include cache misses, editorial activity, imports, feeds, and background processing that compete with public requests.
Use these actions to plan capacity from measured workload growth:
- Measure reads, writes, connections, and lock time.
- Track storage and table growth.
- Observe replication or backup impact.
- Review limits with the hosting provider.
Model a realistic growth step and test it outside production. Confirm that alerts fire before customer journeys breach the service objective and that responders know the escalation path.
When capacity remains insufficient after targeted fixes, compare the evidence with the options in the enterprise WordPress architecture guide. This keeps infrastructure decisions connected to measured demand.
Connect database optimization to the delivery architecture
For decoupled delivery patterns, read our headless WordPress architecture guide.
Base architecture changes on measured constraints, recovery needs, and operating cost. A WordPress performance assessment can help distinguish database work from other fixes.
FAQ
These answers clarify common WordPress database optimization decisions for high-traffic content portals.
Does optimizing a WordPress database automatically make every page faster?
No. Database work helps only when measured database activity contributes meaningfully to the delay. A slow remote service or saturated application worker pool requires a different fix.
Should I install a database cleanup plugin?
Use a cleanup tool only for a defined retention task, after reviewing what it removes and testing its report on staging. Do not run broad deletion by default.
Will adding an index always improve a slow query?
No. Indexes can help matching filters or sorts, but they add storage and write overhead. Compare the execution plan and realistic workload before and after.
Is a persistent object cache the same as page caching?
No. Page cache can reuse a rendered response, while object cache stores selected data objects. Choose based on which repeated work is measured.
Can I run WP-CLI database optimization on a live site?
Only after confirming engine support, host guidance, backup recovery, and a suitable maintenance window. Test first, then monitor errors and query behavior.
How should a team choose a slow-query threshold?
Start with the service objective and observed latency distribution. Use a threshold that captures meaningful cost without flooding logs, then adjust from evidence.
What should be measured after a database change?
Compare query time, cumulative database time, request latency, error rate, cache behavior, write cost, resource use, and the correctness of affected journeys.
When is database cleanup worth prioritizing?
Prioritize it when measured table growth, scans, backups, maintenance, or retention obligations create material cost. Do not delete records for cosmetic size reduction.
Can object caching hide an inefficient query?
Yes. A cache may reduce executions while the underlying query remains expensive. Measure cold and warm behavior, invalidation, and fallback during cache unavailability.
Who should approve a production index change?
The accountable application and database owners should approve it with evidence, maintenance timing, monitoring, rollback criteria, and an assessment of write impact.








Leave a Reply