
Define Monitoring Objectives Around User Impact
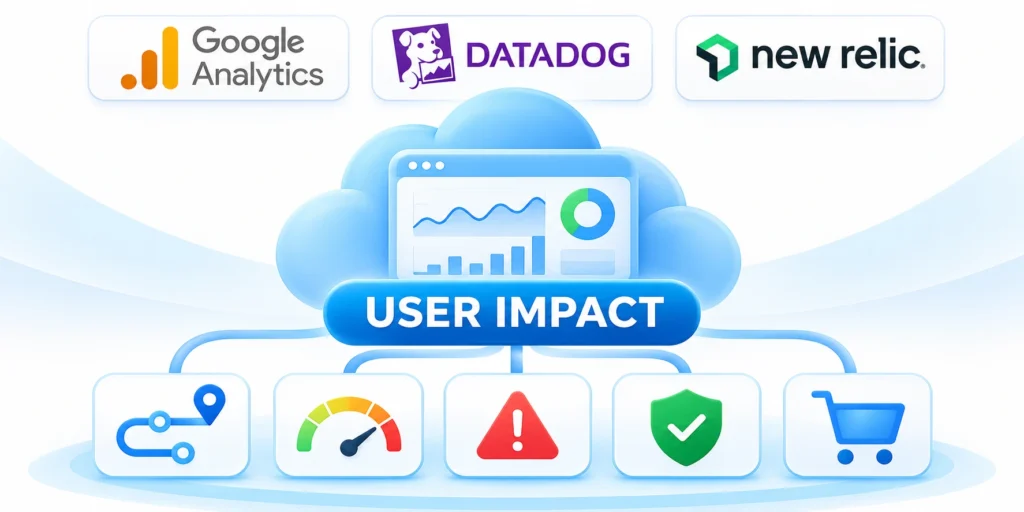
Cloud monitoring best practices begin with the user experience and business journey, not a collection of infrastructure charts. Objectives clarify which failures require action.
Identify the transactions customers and employees depend on. Connect each journey to measurable availability, latency, correctness, freshness, and completion outcomes.
Translate business journeys into service objectives
Map each critical journey from browser or client through APIs, services, data stores, queues, vendors, and downstream systems. Record the accountable owner.
Define good events, total events, exclusions, and measurement windows for customer-relevant indicators. Avoid substituting server uptime for completed business work.
Key considerations for translate business journeys into service include:
- Name critical user journeys.
- Define measurable good events.
- Assign an accountable owner.
- Set review and escalation thresholds.
Choose objectives from customer expectations, business impact, architecture, contracts, and current capability. Do not copy reliability targets without understanding their cost.
Measure both rapid failures and sustained degradation. Short and long windows expose different problems and support proportionate operational decisions.
Use objectives to drive decisions
Connect thresholds to specific actions such as investigation, traffic reduction, rollback, capacity changes, vendor escalation, or temporary restrictions on risky releases.
Document who receives each signal and what authority they possess. A visible breach without ownership or response policy creates observation rather than control.
Apply these criteria to objectives to drive decisions:
- Tie thresholds to actions.
- Document responder authority.
- Review objectives after major changes.
- Remove unused monitoring signals.
Review objectives when products, customers, traffic, architecture, or commitments change. Preserve definitions when comparing trends and explain any necessary measurement breaks.
Keep the initial objective set small. Add another indicator only when it reveals a distinct failure mode or supports a different operational decision.
Map Services, Dependencies, and Owners
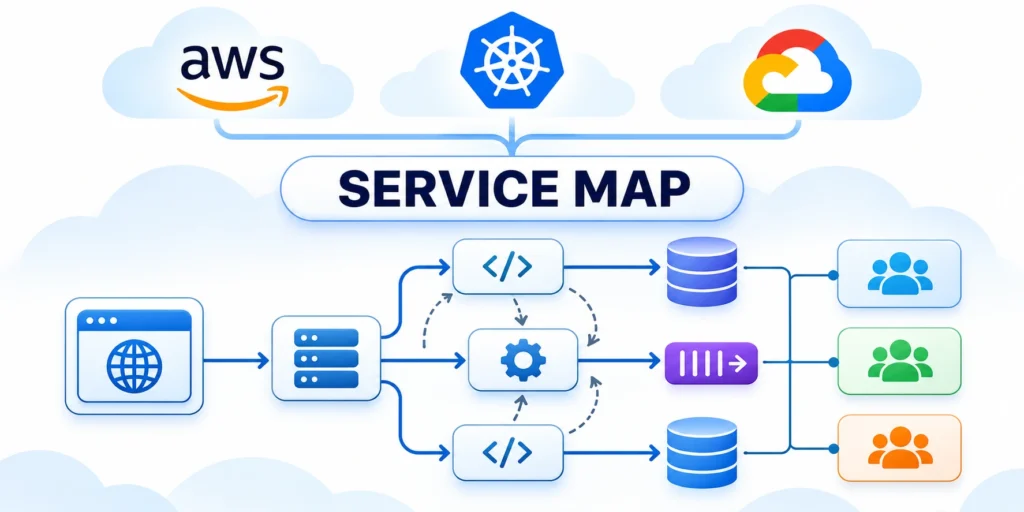
Monitoring becomes actionable when teams understand which components support a user journey and who owns each decision. Unmapped dependencies create slow and fragmented response.
Build a living service map from architecture, telemetry, configuration, deployment, and owner interviews. Mark uncertainty instead of presenting assumptions as verified relationships.
Create a useful service topology
Record services, APIs, data stores, queues, networks, identity providers, external vendors, scheduled jobs, and user interfaces. Include direction and criticality for each dependency.
Link every production component to an owner, repository, deployment path, dashboard, alert route, runbook, and support schedule. Expose missing ownership immediately.
Use these actions to create a useful service topology:
- Map customer-facing services.
- Include internal and vendor dependencies.
- Assign one accountable owner.
- Link dashboards and runbooks.
Use distributed tracing, network observations, logs, configuration, and code to verify dependencies. Compare observed traffic with documented architecture and investigate material differences.
Distinguish required, optional, degraded, obsolete, and unknown dependencies. This classification helps responders interpret failures and select safe mitigation actions.
Keep ownership and topology current
Update service records through normal change workflows rather than occasional documentation campaigns. New dependencies should appear when teams introduce them, not after incidents.
Review shared platforms and third-party services separately because one failure may affect many journeys. Document escalation, contractual expectations, and contingency behavior.
Use these actions to keep ownership and topology current:
- Automate discovery where practical.
- Reconcile documentation with telemetry.
- Track unknown dependencies.
- Review shared failure boundaries.
Use the map during incident exercises and real response. Revise any relationship, owner, or escalation path that responders discover only under pressure.
A service map should reduce diagnostic time and clarify responsibility. Remove decorative detail that does not support monitoring, response, capacity, security, or recovery decisions.
Collect Metrics, Logs, Traces, and Events
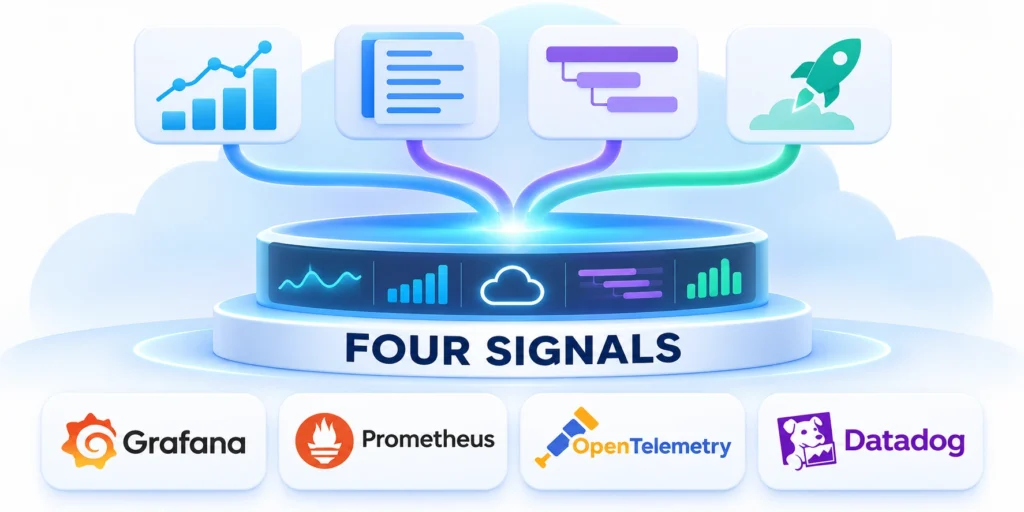
Reliable observability combines several telemetry types because no single signal explains every failure. Collection should support defined decisions without creating uncontrolled volume.
Design telemetry around customer journeys, service objectives, architecture risks, and operational questions. Instrumentation without a question often becomes expensive data with little use.
Use each signal for its strengths
Metrics summarize rates, errors, duration, saturation, and business outcomes over time. They support efficient alerting, trends, capacity planning, and objective measurement.
Logs preserve detailed events and context for diagnosis, audit, and investigation. Structured fields improve filtering, correlation, retention control, and sensitive-data handling.
Apply these criteria to each signal for its strengths:
- Measure rates and errors.
- Structure diagnostic logs.
- Trace important request paths.
- Record deployments and configuration changes.
Traces connect work across distributed components and expose latency or failure concentration. Apply sampling deliberately so important errors and slow paths remain visible.
Events provide operational context for deployments, feature changes, scaling, incidents, vendor disruptions, and configuration updates. Correlation reduces unsupported root-cause assumptions.
Standardize telemetry without hiding context
Define naming, units, labels, timestamps, correlation identifiers, environments, ownership, and data classifications. Consistency enables shared tooling and cross-service investigation.
Avoid high-cardinality labels that create cost and performance problems. Preserve necessary dimensions through logs, traces, exemplars, or controlled attribute sets.
Key considerations for standardize telemetry without hiding context include:
- Standardize names and units.
- Control high-cardinality dimensions.
- Protect sensitive information.
- Validate telemetry during failures.
| Signal | Best question | Primary use |
|---|---|---|
| Metrics | What changed? | Alerting and trends |
| Logs | What happened? | Detailed diagnosis |
| Traces | Where did time go? | Distributed requests |
| Events | What changed nearby? | Operational context |
Test instrumentation during normal load, deployment, dependency failure, and recovery. A signal that disappears during disruption cannot support reliable diagnosis.
Assign ownership for instrumentation libraries, collectors, pipelines, schemas, and retention. Observability infrastructure requires the same reliability discipline as customer applications.
Build Actionable Dashboards
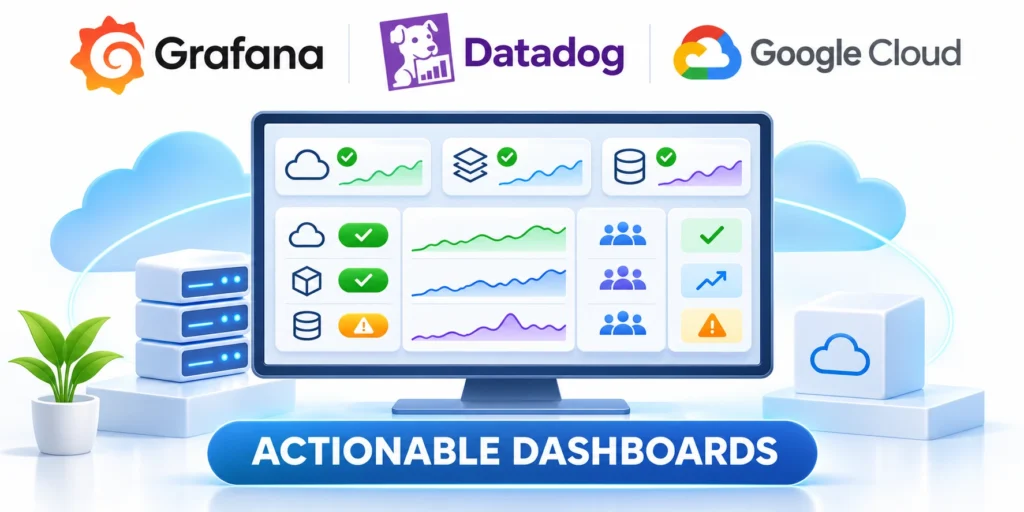
Dashboards should help a defined audience answer operational questions and make decisions. A crowded wall of charts often hides service health and ownership.
Create separate views for customer impact, service operations, dependency diagnosis, capacity, and executive outcomes. Reuse consistent definitions across those perspectives.
Organize dashboards around decisions
Start with customer journeys and service objectives. In a cloud modernization assessment, baseline traffic, latency, errors, and saturation before changing the platform.
Add dependency and deployment context near the affected service signals. Responders should see recent changes and downstream conditions without opening many disconnected tools.
Key considerations for organize dashboards around decisions include:
- Lead with customer impact.
- Show objectives and trends.
- Include deployment context.
- Link owners and runbooks.
Label units, aggregations, filters, exclusions, and data freshness clearly. Avoid averages that conceal tail latency, regional failures, or a small affected customer segment.
Use visual hierarchy to emphasize breached objectives and unexpected behavior. Color should reinforce meaning without becoming the only way users distinguish status.
Treat dashboards as operational products
Assign an owner and review cadence to every operational dashboard. Remove panels that never affect decisions, and replace unreliable queries or ambiguous metrics.
Test dashboards during exercises and incidents. Observe which panels responders trust, ignore, misinterpret, or cannot access under real operating conditions.
Use these actions to treat dashboards as operational products:
- Assign dashboard ownership.
- Validate units and freshness.
- Test views during incidents.
- Retire unused panels.
Control dashboard changes through versioning or review when they support critical response. An unnoticed query change can invalidate historical comparison or alert interpretation.
Provide drill-down paths from business symptoms to services, dependencies, logs, and traces. Preserve context so each transition narrows the investigation effectively.
Create Alerts That Reduce Noise
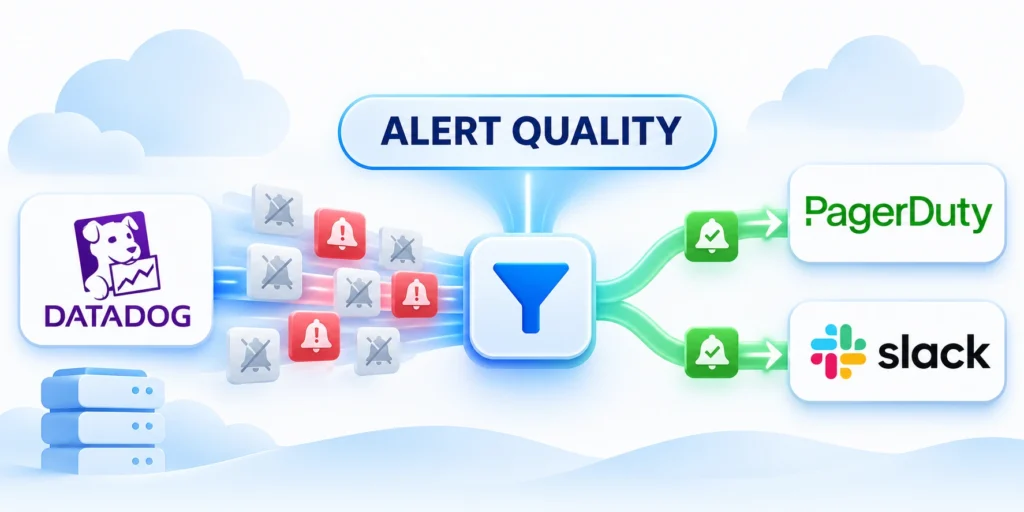
An alert deserves immediate attention only when a responder must act within a defined timeframe. Excessive noise trains teams to delay or ignore notifications.
Alert on customer impact, objective burn, failed critical workflows, and conditions requiring timely intervention. Use dashboards or tickets for lower-urgency observations.
Design alerts around actionable conditions
Every alert should identify the affected service, environment, severity, evidence, likely customer impact, owner, dashboard, runbook, and escalation route.
Set thresholds from expected behavior, objectives, historical variation, and failure risk. Static percentages without operational context create false positives or missed incidents.
Use these actions to design alerts around actionable conditions:
- Alert on actionable conditions.
- Include context and ownership.
- Use severity-based routing.
- Define escalation and suppression.
Combine related symptoms where practical and suppress dependent noise after a known root failure. Preserve enough detail for responders to understand the affected scope.
Use multiple windows for rapid and sustained degradation. Brief spikes and slow burns require different thresholds, urgency, and mitigation decisions.
Measure alert quality continuously
Track alert volume, actionable rate, acknowledgment, escalation, repeat causes, after-hours disruption, and alerts associated with real incidents. Review trends by service.
Classify noisy alerts as delete, tune, aggregate, downgrade, or instrument differently. Assign corrective work instead of accepting permanent responder fatigue.
Use these actions to measure alert quality continuously:
- Measure actionable alert rate.
- Review repeat notifications.
- Remove stale alert rules.
- Verify routing after ownership changes.
Test alert delivery, permissions, schedules, and backup escalation regularly. A correct detection rule still fails if it cannot reach an authorized responder.
Connect alert design with a clear SRE and DevOps operating model so service ownership and response authority remain explicit.
Add Synthetic and Real User Monitoring

Infrastructure and application telemetry may appear healthy while customers face browser, network, geography, or third-party failures. User-centered monitoring exposes that gap.
Combine synthetic tests with real user monitoring because they answer different questions. Protect privacy and avoid collecting unnecessary customer information.
Use synthetic monitoring for controlled journeys
Run scheduled tests for availability, authentication, search, checkout, forms, APIs, and other critical workflows. Include representative regions, devices, and network conditions.
Keep tests deterministic, independently credentialed, and isolated from production analytics where necessary. Monitor test dependencies so false failures remain identifiable.
Apply these criteria to synthetic monitoring for controlled journeys:
- Test critical customer journeys.
- Use representative locations.
- Protect synthetic credentials.
- Monitor the test system.
Real user monitoring measures actual page load, interaction, errors, devices, browsers, networks, and geography. It reveals variation that controlled tests cannot reproduce.
Define sampling, consent, retention, redaction, and access according to business and legal requirements. Avoid storing sensitive content within telemetry payloads.
Correlate user evidence with services
Carry safe correlation identifiers from client experiences into backend traces and logs. This connection shortens diagnosis while preserving data minimization.
Compare synthetic, real-user, service, and business signals during disruptions. Differences help locate client, network, regional, dependency, or backend failures.
Key considerations for correlate user evidence with services include:
- Correlate client and backend signals.
- Segment by meaningful dimensions.
- Redact sensitive values.
- Review sampling bias.
Alert only when user-centered evidence requires timely action. Use trend analysis for slower experience degradation, browser changes, and regional performance differences.
Review journey coverage after product changes. New navigation, authentication, payment, or integration behavior can silently invalidate synthetic scripts and monitoring assumptions.
Connect Monitoring to Incident Response

Monitoring creates value when it accelerates recognition, coordination, mitigation, and learning. Integrate signals with the incident process instead of treating dashboards as a separate activity.
Define severity from customer and business impact. Update it as evidence changes rather than defending the initial alert or classification.
Provide responders with immediate context
Route actionable alerts to current owners and include service maps, dashboards, changes, runbooks, dependencies, and escalation contacts. Remove unnecessary navigation during urgent response.
Create one incident timeline that records detection, decisions, actions, evidence, communications, and recovery. Automated context should support rather than overwhelm responders.
Key considerations for provide responders with immediate context include:
- Route alerts to service owners.
- Attach dashboards and runbooks.
- Record one incident timeline.
- Escalate by customer impact.
Give responders authority to stop releases, reduce features, reroute traffic, scale resources, fail over, or escalate vendors within documented safety boundaries.
Use monitoring to confirm whether mitigation improves customer outcomes. Infrastructure recovery without user-journey recovery may indicate another unresolved failure.
Turn incidents into monitoring improvements
After restoration, compare what monitoring detected with what customers experienced. Identify blind spots, noisy signals, missing context, delayed routing, and misleading dashboards.
Assign corrective actions with owners, deadlines, and expected effects. Verify whether completed changes improve detection, diagnosis, mitigation, or recovery during later events.
Key considerations for turn incidents into monitoring improvements include:
- Compare detection with actual impact.
- Correct monitoring blind spots.
- Verify completed improvements.
- Update exercises and runbooks.
Preserve incident evidence according to retention and access requirements. Avoid exposing sensitive data within chat, tickets, dashboards, or broadly shared timelines.
Exercise incident workflows before major releases and architecture changes. Tests should include alert routing, permissions, communications, vendor escalation, recovery, and handoffs.
Control Retention and Monitoring Costs
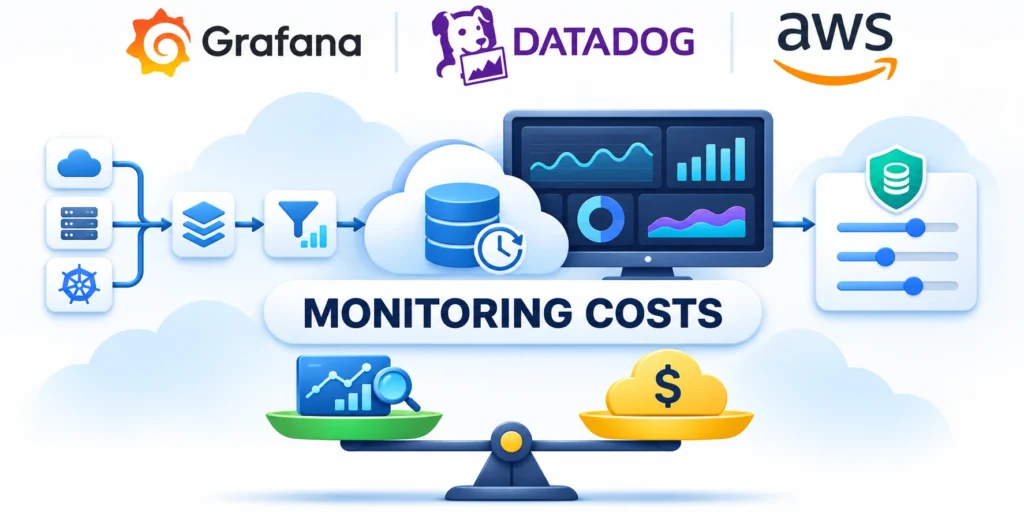
Observability cost grows with traffic, cardinality, collection breadth, retention, indexing, and query patterns. Control spending without removing evidence needed for reliable operations.
Map telemetry cost to services, environments, owners, and use cases. Shared invoices without attribution make waste and business value difficult to evaluate.
Match data treatment to operational value
Classify telemetry by alerting, diagnosis, objective reporting, audit, capacity, security, and learning needs. Each purpose may require different fidelity and retention.
Keep high-value signals readily searchable and move older detail to lower-cost storage when retrieval delay remains acceptable. Define deletion and legal retention explicitly.
Key considerations for match data treatment to operational include:
- Attribute cost by service.
- Classify telemetry by purpose.
- Set tiered retention periods.
- Remove unused data sources.
Use sampling for high-volume traces and events while preserving errors, slow requests, rare paths, and representative normal traffic. Validate sampling bias regularly.
Control labels and dimensions that multiply time series or indexes. Provide approved patterns so teams avoid uncontrolled cardinality without losing necessary context.
Govern observability as a shared platform
Publish cost dashboards, budgets, anomaly alerts, quotas, retention defaults, and exception processes. Teams need visibility before finance surprises force indiscriminate cuts.
Review unused dashboards, alerts, indexes, collectors, exports, and duplicated pipelines. Decommissioning stale telemetry reduces cost and operational complexity together.
Key considerations for govern observability as a shared include:
- Use deliberate trace sampling.
- Control cardinality growth.
- Alert on cost anomalies.
- Review exceptions and quotas.
Measure cost alongside incident outcomes, diagnostic speed, coverage, and user experience. The cheapest monitoring program can become expensive through longer outages and hidden failures.
Evaluate vendor pricing and exit constraints before centralizing critical telemetry. Preserve export, ownership, and continuity options for important operational evidence.
Review Reliability Coverage Regularly
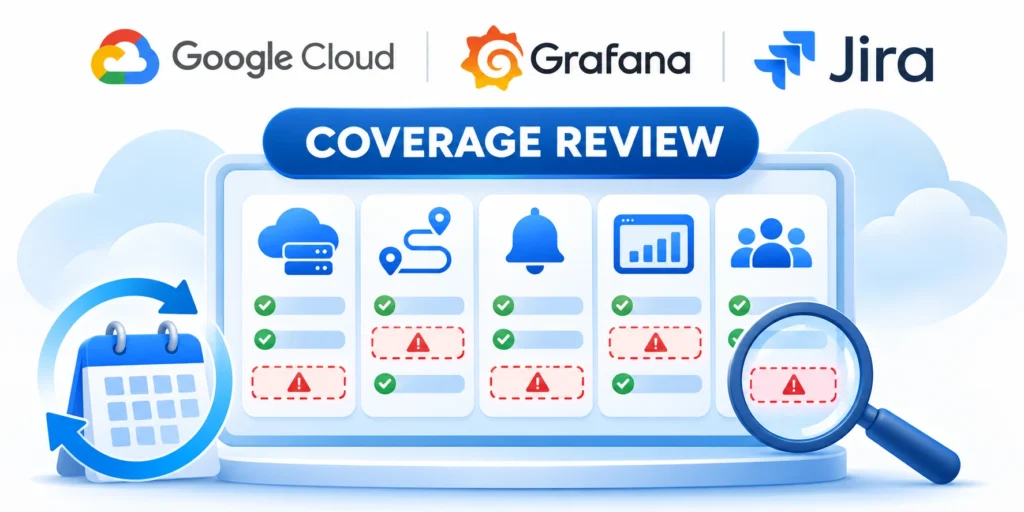
Monitoring coverage changes as products, dependencies, traffic, teams, and vendors evolve. Regular review prevents silent gaps and stale alerts from becoming accepted risk.
Review coverage using representative services and recent evidence rather than only configuration counts. Many signals can coexist with poor detection and unclear ownership.
Audit coverage across critical journeys
For each journey, verify objectives, telemetry, dashboards, alerts, synthetic tests, user evidence, dependencies, ownership, runbooks, escalation, backups, and recovery validation.
Sample critical, typical, and problematic services. Include different architectures, regions, vendors, deployment models, and support schedules to expose inconsistent practices.
Use these actions to audit coverage across critical journeys:
- Sample representative services.
- Trace complete user journeys.
- Verify ownership and escalation.
- Inspect recent real incidents.
Use recent releases and incidents as traceable cases. Ask which signals appeared, who received them, what decisions followed, and which evidence remained missing.
Compare documented expectations with actual behavior. Treat missing, stale, inaccessible, or distrusted monitoring as an operational finding requiring ownership.
Prioritize improvements by risk
Rank findings by customer impact, recurrence, diagnostic delay, shared dependency, detection weakness, and implementation effort. Fix foundational ownership and telemetry gaps first.
Assign a small improvement set with owners, deadlines, affected services, expected outcomes, and verification methods. Avoid broad programs without measurable completion.
Use these actions to prioritize improvements by risk:
- Rank gaps by customer risk.
- Fix foundational visibility first.
- Assign measurable corrective actions.
- Verify improvements after release.
Repeat review after material architecture, product, vendor, or ownership changes. A fixed annual review cannot protect rapidly changing cloud systems.
Share patterns and reusable fixes through platform templates, instrumentation libraries, alert rules, dashboards, training, and incident exercises while preserving service-specific context.
Conclusion
Cloud monitoring works when it connects user impact, service topology, trustworthy telemetry, actionable dashboards, alert quality, incident response, and accountable improvement.
Tools support that system, but they cannot replace objectives, ownership, decision thresholds, response authority, cost control, or continuous reliability review.
Build monitoring as an operating capability
Start with one critical journey and trace it through every dependency. Define objectives, owners, signals, dashboards, alerts, runbooks, and verification methods.
Test the complete path during controlled failures and incident exercises. Correct any signal, permission, routing, context, or authority gap before expanding coverage.
Use these actions to build monitoring as an operating capability:
- Start with one critical journey.
- Connect signals to decisions.
- Test response under failure.
- Correct gaps before scaling.
Standardize common telemetry and platform capabilities while allowing services to preserve meaningful context. Shared patterns should reduce effort without flattening important differences.
Control data volume through purpose, retention, sampling, and ownership. Remove stale monitoring before adding another platform, dashboard, alert, or export pipeline.
Choose the next reliability improvement
Select the highest-risk monitoring gap supported by evidence. Name the owner, affected journey, expected improvement, validation method, and review date.
Use customer and incident outcomes to judge progress. More telemetry is useful only when it improves detection, understanding, response, recovery, or prevention.
Use these actions to choose the next reliability improvement:
- Name the next coverage gap.
- Assign one accountable owner.
- Define measurable validation evidence.
- Review the observed outcome.
Reliable monitoring should make uncertainty visible and decisions faster. It should also reduce responder burden through better context, routing, automation, and learning.
Continue revising the system as applications and organizations change. Monitoring that remains static will eventually describe an environment that no longer exists.
FAQ
These answers address common questions about cloud monitoring objectives, telemetry, dashboards, alerts, user evidence, incident response, cost, and ongoing reliability coverage.
What are cloud monitoring best practices?
Define customer-centered objectives, map dependencies and owners, collect purposeful telemetry, build actionable dashboards, reduce alert noise, integrate incident response, and review coverage regularly.
Which signals should a web application collect?
Collect metrics, structured logs, distributed traces, deployment events, synthetic tests, real-user evidence, and business outcomes according to specific operational questions and decisions.
How many monitoring tools does a team need?
Use the smallest toolset that provides reliable coverage, correlation, access, retention, and response integration. Additional tools should solve documented gaps rather than duplicate capabilities.
What makes a dashboard actionable?
An actionable dashboard shows customer impact, service objectives, trends, dependencies, ownership, recent changes, and clear drill-down paths for a defined audience and decision.
How can teams reduce alert fatigue?
Alert only on conditions requiring timely action, include context and ownership, aggregate related symptoms, measure actionable rate, and remove or downgrade persistent noise.
What is synthetic monitoring used for?
Synthetic monitoring runs controlled checks of important journeys from representative locations. It can detect availability or workflow failures before enough real users encounter them.
Why is real user monitoring important?
Real user monitoring reveals actual browser, device, network, regional, and interaction experience. It exposes variation that infrastructure metrics and controlled tests may miss.
How should monitoring support incident response?
Monitoring should route actionable evidence to current owners with dashboards, runbooks, changes, dependencies, escalation, and authority needed to mitigate customer impact.
How can observability costs be controlled?
Attribute cost, classify telemetry by purpose, set retention tiers, sample deliberately, control cardinality, remove unused data, and compare spending with operational outcomes.
How often should monitoring coverage be reviewed?
Review after significant product, architecture, vendor, or ownership changes and after material incidents. Use a recurring cadence appropriate to service risk and change rate.