


What a server cost estimate should include
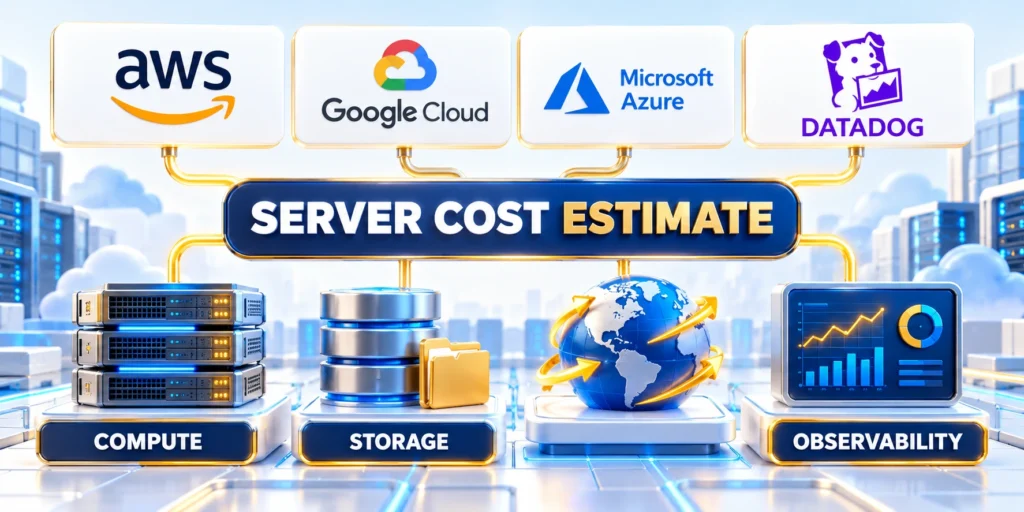
Estimate high-traffic web app server costs by identifying the services needed to deliver requests, store application data, and operate the system.
Start with recurring infrastructure expenses. Keep implementation labor, one-time migration, and product development in a separate budget so comparisons remain meaningful.
Separate server infrastructure from total application ownership
“Server cost” can mean a virtual machine bill or the full monthly platform bill. State which definition the estimate uses before comparing options.
For a high-traffic application, include compute, database, object storage, backups, network transfer, load balancing, CDN, monitoring, support, and required licenses.
Classify Fixed and Usage-Based Charges
Some costs are fixed monthly commitments; others vary with usage. Record each line as fixed, usage-based, or commitment-based to expose risk.
For implementation and initial product costs, see our custom web application cost guide. Keep that budget separate from recurring infrastructure.
Create a cost inventory before opening calculators
Map every service required to deliver, secure, observe, recover, and support the application before entering quantities into a provider calculator.
Include these categories in the inventory:
- Compute, orchestration, and background workers.
- Databases, caches, and managed data services.
- Storage, backups, and recovery copies.
- Network transfer, CDN, DNS, and gateways.
- Monitoring, security, support, and licenses.
- Nonproduction environments and operational labor.
Assign a pricing unit, workload driver, source, date, owner, and uncertainty to each line. Exclude no dependency merely because another team pays it.
Define traffic and workload assumptions
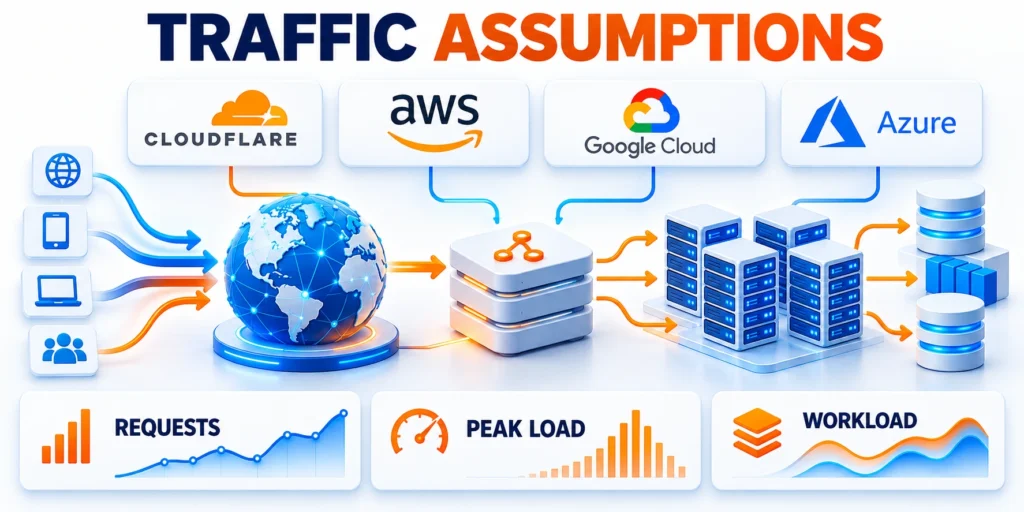
Provider calculators need workload inputs. A traffic total alone is insufficient because requests vary in duration, data transfer, personalization, and database work.
Write down the expected request rate, concurrency, payload sizes, cache behavior, geographic distribution, and peak duration. Mark measured values separately from estimates.
Translate monthly visits into requests
Estimate dynamic requests per user session, then multiply by sessions. Static assets served by a CDN should not be treated as equivalent to application requests.
For example, a planning model might use 500,000 monthly sessions and 12 dynamic requests per session. That produces 6 million dynamic requests monthly, before background jobs.
Replace the Example with Measured Inputs
This is an illustration, not a forecast. Replace the inputs with analytics, API gateway logs, or a representative load test from the target application.
Record the observation window and measurement source so reviewers can distinguish production evidence from assumptions used only for sensitivity testing.
Distinguish average load from peak concurrency
Monthly totals help estimate usage fees, but peak concurrency often determines required application capacity. Record ordinary and peak requests per second separately.
Use a known busy interval when available. If no reliable history exists, define a low, base, and high scenario instead of presenting one precise number.
Include Background Workloads
Public requests are only part of demand. Imports, exports, queues, scheduled jobs, indexing, media processing, reporting, and backups also consume resources.
Measure these workload dimensions separately:
- Executions per hour or day.
- Typical and maximum task duration.
- CPU, memory, storage, and network use.
- Concurrency and acceptable completion delay.
- Retry behavior and failure amplification.
Place delay-tolerant work in separate capacity assumptions so a campaign spike or failed batch does not silently consume customer-facing headroom.
Capture service-level requirements
Latency targets, availability objectives, and recovery objectives influence redundancy and capacity. These choices affect cost even when user traffic stays unchanged.
Document the required regions, failover design, retention period, and backup recovery point. Do not add multi-region replicas unless the service requirement calls for them.
Map the architecture to billable resources
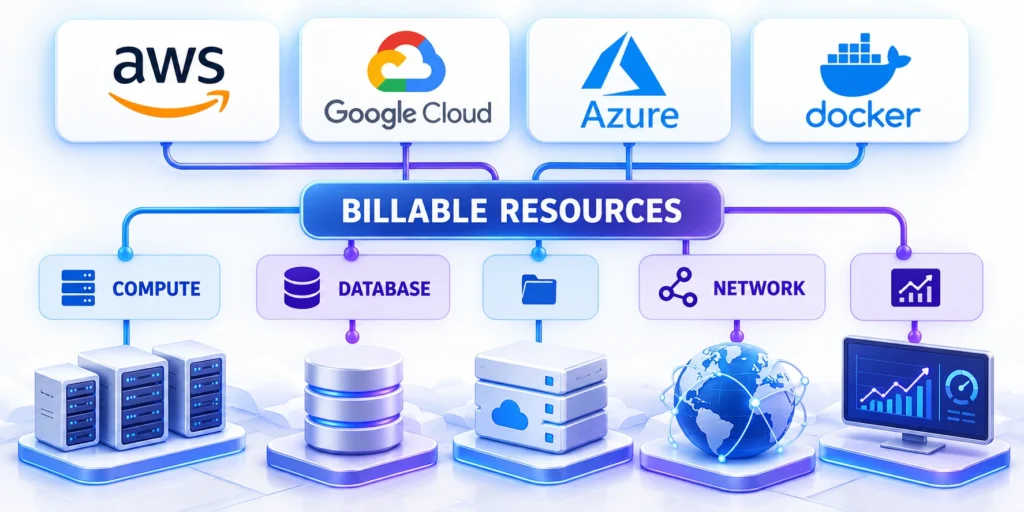
Turn the architecture diagram into a resource inventory. Each production component should map to a calculator line item, an internal platform charge, or an explicit exclusion.
For each resource, record its size, region, count, operating hours, storage, and usage unit. Note dependencies that create additional charges, such as snapshots or outbound transfer.
Build a Resource Worksheet
Translate the architecture diagram into billable resources and connect each resource to its workload, availability, security, and recovery requirement.
Record these fields for each resource:
- Service, region, tier, and quantity.
- Pricing unit and expected utilization.
- Baseline, peak, and recovery capacity.
- Data retention and transfer assumptions.
- Dependency owner and calculator source.
- Scaling rule and review trigger.
| Resource | Billing unit | Workload driver |
|---|---|---|
| Compute | Instance-hour | Baseline and peak load |
| Database | Service-hour and storage | Queries, data, recovery |
| Network | GB transferred | Response size, regions, and destinations |
| Operations | Hours and support tier | Incidents and changes |
| Security operations | Tool or service tier | Events, identities, coverage |
| Platform support | Monthly plan or labor hours | Coverage and response target |
Keep shared services visible rather than spreading them invisibly across application lines. Reviewers should be able to reconcile every worksheet row with architecture.
Include managed and self-managed components consistently
Managed services reduce some operational work but can include higher service rates. Self-managed services may shift costs into engineering time, patching, backup, and incident response.
Compare equivalent responsibilities. A virtual machine price alone is not equivalent to a managed database that includes automated backups and maintenance.
Include Operational Effort in the Estimate

Infrastructure charges exclude much of the work needed to configure, secure, monitor, patch, recover, optimize, and support a high-traffic application.
Estimate recurring and event-driven effort separately so a low platform bill does not conceal an expensive or fragile operating model.
Map recurring operational responsibilities
Identify the people or managed services responsible for availability, deployment, observability, security, data, backups, performance, incidents, and provider coordination.
Include these recurring activities in the model:
- Monitoring, alert review, and incident response.
- Patching, upgrades, testing, and deployment.
- Backup verification and recovery exercises.
- Capacity review and performance optimization.
- Security review and access administration.
- Vendor, license, and support management.
Assign hours, skill level, cadence, and owner to each activity. Avoid counting a managed service as labor-free when internal coordination remains necessary.
Model incident and change effort
Production incidents, migrations, major releases, scaling events, and recovery tests create irregular costs that monthly averages can hide.
Estimate these event-driven effort categories:
- Investigation and stakeholder communication.
- Emergency changes and validation.
- Data recovery and reconciliation.
- Post-incident review and corrective work.
- Provider escalation and evidence collection.
Use a scenario range rather than predicting exact incidents. Preserve assumptions about event frequency, duration, staffing, and external support.
Compare managed and self-managed models
A managed service may increase provider charges while reducing maintenance burden, specialist staffing, or recovery complexity.
Compare total responsibility, response time, control, portability, internal capability, and residual work instead of treating the monthly platform price as total cost.
Estimate compute capacity and scaling

Compute estimates depend on request concurrency, CPU and memory usage, runtime behavior, and the desired headroom. Use representative application measurements where possible.
Measure a realistic route or job in staging. Record resource use under a known request rate and note the application build, data size, and test conditions.
Estimate baseline and peak instances
Model the instances required for ordinary traffic and peak traffic separately. Include minimum capacity that remains running and any warm capacity required for fast scale-out.
If a test sustains 100 requests per second on four instances, that ratio is only a starting point. Validate with realistic payloads and latency targets before extrapolating.
Calculate Instance-Hours
For a concrete hours model, suppose three instances run all month and four extra instances run for 40 peak hours. That totals 2,350 instance-hours across the month.
Application behavior may not scale linearly. Shared database limits, locks, external APIs, or memory pressure can change capacity as instances increase.
Account for autoscaling behavior
Estimate how long peak capacity remains active and how quickly autoscaling can add instances. A short peak may cost less than a full month at peak size.
Check minimum, maximum, and scaling thresholds. Include a guardrail that caps unexpected expansion and alerts an operator before spending exceeds the planned range.
Compare Traffic Shapes
Two applications with equal monthly requests can require different capacity when one is steady and the other concentrates demand into short peaks.
Model these traffic characteristics independently:
- Sustained baseline requests per second.
- Peak rate and expected duration.
- Authenticated and personalized request share.
- Cache-hit and cache-miss behavior.
- Regional distribution and failover demand.
- Autoscaling startup and cooldown delay.
Calculate instance-hours for each scenario and preserve unused safety headroom explicitly. Do not hide resilience capacity inside an unexplained utilization assumption.
Include compute attached to asynchronous work
Queue consumers, scheduled jobs, and event processors use capacity too. Estimate their runtime and frequency instead of folding them invisibly into web-server headroom.
For serverless compute, capture invocation count, execution duration, memory allocation, and any provisioned concurrency. For virtual machines, capture instance-hours and attached disks.
Model databases, storage, and backups
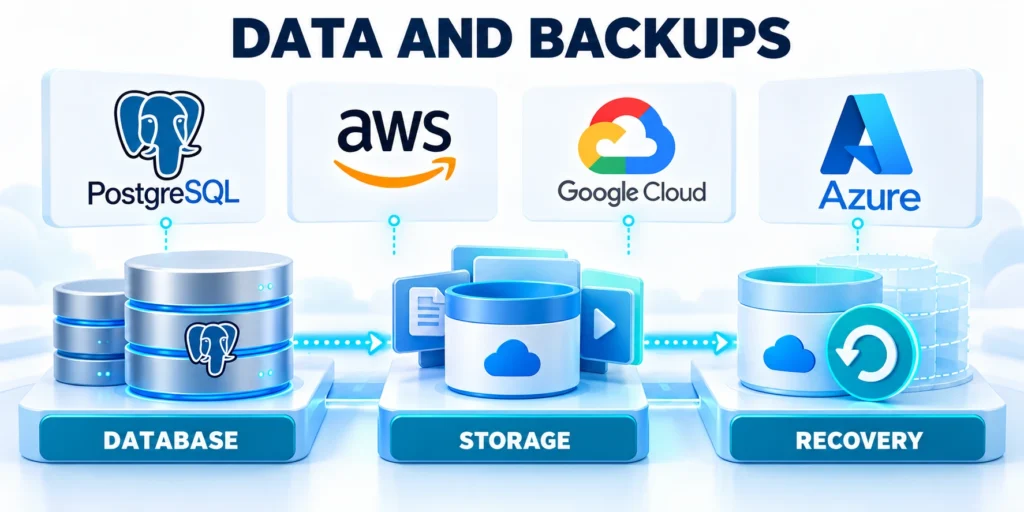
Data services can become a large and persistent part of the bill. Estimate database capacity, storage growth, backup retention, replicas, and read or write demand separately.
Use current database size and growth rates when available. Separate frequently accessed data from archives, logs, and user-uploaded objects.
Estimate database capacity from observed demand
Measure query throughput, connection counts, storage use, and latency under representative application traffic. Identify whether CPU, memory, I/O, or connections limits performance.
Managed database prices can vary by instance class, storage type, provisioned IOPS, backup retention, and region. Add replicas only when the architecture needs them.
Separate Database Tuning Work
If query latency is the measured issue, use the separate WordPress database optimization guide to plan diagnosis and tuning.
Include a growth scenario. A database that grows steadily may cross a storage or capacity tier during the forecast period.
Add object storage and backup retention
Calculate stored object volume, average object size, monthly growth, and retrieval pattern. Include request charges and outbound transfer when the provider prices them separately.
Estimate backup storage using retained recovery points and change rate. Do not assume backup capacity equals exactly one database copy unless the service confirms that billing model.
Price Recovery Features
Recovery objectives change database replicas, snapshots, cross-region copies, storage retention, network transfer, testing, and operator requirements.
Include these recovery cost drivers:
- Snapshot frequency and retention period.
- Replica count and target regions.
- Backup storage and retrieval charges.
- Cross-region replication and transfer.
- Restore testing and operator time.
- Temporary capacity during recovery exercises.
Price the architecture that can meet the approved recovery objective. A backup line without tested restoration does not prove recoverability.
Consider nonproduction data safely
Staging databases and test snapshots can create meaningful costs. Keep only the data and retention needed for testing, privacy, and recovery validation.
Use anonymized or reduced datasets when appropriate. Avoid copying production personal data into lower environments without approved controls.
Account for network, CDN, and observability

Network expenses depend on where data moves. Separate inbound traffic, cross-region traffic, internet egress, CDN delivery, and service-to-service transfer.
Estimate response and upload sizes from real samples. Multiply by requests or sessions, and check the provider’s billing definition for each transfer path.
Estimate data transfer and CDN delivery
CDNs can deliver cacheable static assets, while personalized responses still reach the application. Model both paths separately.
Use cache logs or a controlled test to estimate hit ratio. Include origin fetches, cache invalidations, and requests that bypass the CDN.
Include Egress Charges
Data leaving a provider, region, availability zone, CDN, or managed service may use different billing rules and free allowances.
Separate these transfer paths in the estimate:
- Origin delivery to CDN edges.
- CDN delivery to application users.
- Cross-zone and cross-region service traffic.
- Database replication and backup transfer.
- External APIs, exports, and partner feeds.
- Monitoring and log delivery destinations.
Use measured response sizes and regional traffic shares where available. Document compression, caching, and free-tier assumptions separately from paid transfer.
Add monitoring, logs, and support
Estimate log ingestion, retention, metrics cardinality, traces, alerting, and incident support. Higher traffic can increase observability charges even when compute stays flat.
Set retention based on operational and compliance needs. Sample verbose traces where appropriate, but preserve enough data to diagnose production incidents.
Add Support and License Fees
Support plans and software licenses may be billed outside the core compute calculator. Add them as explicit lines rather than hiding them in contingency.
Match each fee to the architecture and operating model, including required support coverage, environments, users, usage tiers, and renewal terms.
Compare provider scenarios without false precision
Use each provider’s official estimator with the same workload, region, duration, and service assumptions. A comparison is useful only when the configurations represent equivalent outcomes.
AWS’s calculator supports EC2 estimates; Google Cloud publishes Compute Engine pricing and its calculator; Microsoft documents the Azure Pricing Calculator. Rates can vary by region, currency, contract, and date.
Run low, base, and peak cases
Create three scenarios with transparent inputs. The low case represents lower sustained load. The base case reflects expected workload. Peak-case modeling tests a plausible busy period.
Change a small number of assumptions at a time. This shows whether the estimate is most sensitive to compute hours, database size, egress, or retention.
Document Estimate Limitations
Provider calculators omit migration, incident response, governance, and operational work. Include those costs when scoping cloud consulting and modernization.
State these limitations beside every scenario:
- Unavailable or low-confidence workload inputs.
- Excluded services, labor, taxes, and discounts.
- Uncertain regions, tiers, and architectures.
- Assumed utilization and scaling behavior.
- Price date, currency, and contract status.
- Risks that could materially change demand.
Use ranges when inputs remain uncertain. False precision makes scenarios look comparable while concealing differences that can dominate the final invoice.
Compare the operating model as well as price
Document what each estimate includes: backups, patching, scaling, monitoring, support, and recovery. A lower infrastructure line may require more in-house operations.
Record exclusions and open questions next to each result. Do not rank providers as universally cheapest when configurations or commercial agreements differ.
Build, review, and update the monthly estimate
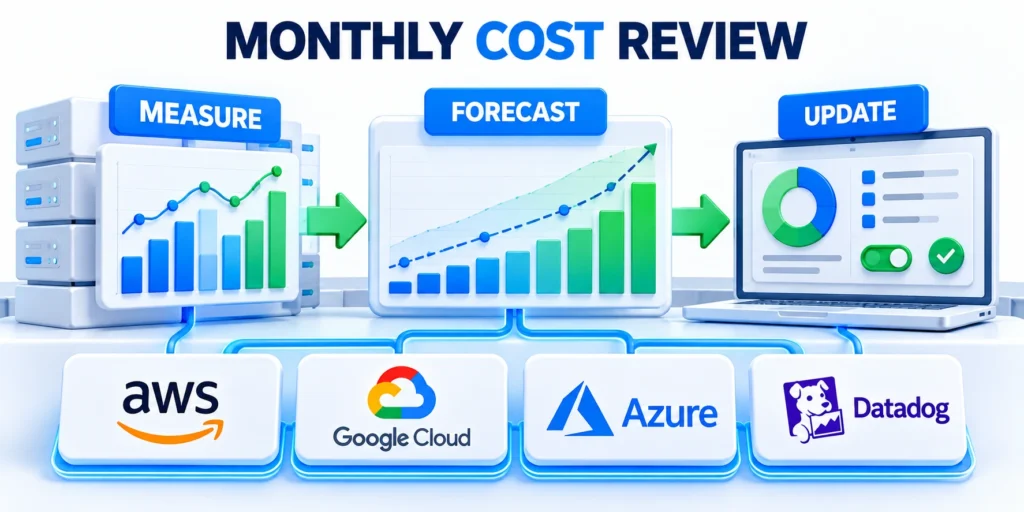
The estimate should be traceable and revisable. Keep its assumptions, source date, selected region, calculator output, and owner together in one worksheet.
Separate committed baseline costs from usage-sensitive costs. Add a contingency range tied to uncertainty rather than an unexplained percentage.
Calculate a monthly scenario from line items
For each item, multiply the pricing unit by expected usage, then sum services and environments. Preserve the provider’s units and currency in the worksheet.
Example: if a test environment runs a known number of instance-hours, calculate those hours separately from production and document its operating schedule.
Use Dated Provider Inputs
Record the provider, region, service tier, pricing unit, currency, calculator URL, retrieval date, and contract assumption for every price.
Preserve these pricing details with each line:
- Public, negotiated, reserved, or spot price.
- Included allowance and overage rate.
- Billing increment and minimum charge.
- Commitment term and cancellation condition.
- Currency conversion and tax treatment.
- Review date and accountable owner.
Recalculate affected scenarios when prices, regions, tiers, discounts, architecture, or workload change. Do not silently carry old inputs into a current forecast.
Validate the estimate against a pilot
Compare predicted resource use with a staged load test or early production telemetry. Investigate the largest variance before adjusting every line item.
Check request volume, instance-hours, database utilization, storage growth, cache hit ratio, and egress. Align the billing period and units before comparing actuals.
Set owners and review triggers
Assign an owner to the forecast and each high-variance service. Review after architecture changes, major campaigns, traffic growth, or pricing-plan changes.
Set budget alerts before a threshold becomes urgent. An alert is a signal to inspect usage; it does not automatically stop workloads or prevent a bill.
Conclusion

A reliable server estimate is a dated operational model that connects measurable workload, architecture, service levels, provider units, and accountable ownership.
Use ranges when evidence remains uncertain, then replace assumptions with observed usage and invoice data as the application matures.
Connect the estimate to architecture governance
Architecture owners, finance, and operations should share workload assumptions, service boundaries, exclusions, review triggers, and evidence for material cost drivers.
Maintain these records with every forecast:
- Workload source, window, and confidence.
- Architecture version and resource inventory.
- Provider, region, unit, price, and date.
- Low, base, peak, and recovery scenarios.
- Operational effort, exclusions, and uncertainty.
- Owner, review trigger, and next decision.
Preserve each model version so reviewers can reproduce assumptions, reconcile later invoices, and explain why the forecast changed.
Reconcile forecasts with actual billing
Apply billing tags or cost-allocation labels consistently across environments and services. Map invoice units back to the forecast categories.
Investigate material differences using these checks:
- Changed workload or traffic shape.
- New resources or duplicated environments.
- Lower cache efficiency or higher transfer.
- Unexpected retention, logging, or backup growth.
- Expired discounts or commitment mismatch.
Revise the model from evidence without rewriting the prior forecast. Historical assumptions remain necessary for understanding decisions and improving future estimates.
Use the estimate as a decision boundary
Define which changes require recalculation, approval, capacity testing, or architectural review before they create unplanned cost or reliability exposure.
For the broader framework, read B2B Web App Development: Architecture, Scalability and Launch.
FAQ
These answers clarify common workload, architecture, provider, and review decisions in high-traffic server cost estimates.
Is server cost the same as cloud hosting cost?
Not always. Server cost may mean compute only, while cloud hosting can include databases, storage, network, backups, monitoring, support, and other platform services.
Can monthly visits predict server cost by themselves?
No. Visits do not show dynamic request volume, peak concurrency, payload sizes, cache behavior, database activity, or geographic transfer.
Should I choose the lowest calculator estimate?
Compare equivalent services and operating responsibilities. Consider reliability, support, recovery, engineering effort, and contractual terms alongside the estimated bill.
How often should a high-traffic app estimate be updated?
Review it when traffic patterns, architecture, regions, retention, or provider pricing changes. Compare forecasts with actual billing at a regular operational review.
Do cloud calculators include every cost?
They estimate configured services, but exclusions and contract details vary. Confirm taxes, support, licenses, discounts, data transfer, and service-specific charges.
How should traffic spikes be represented?
Model ordinary, expected peak, and stress scenarios separately. Record peak duration, concurrency, scaling delay, cache behavior, and capacity that must remain warm.
Use measured busy periods when available. Otherwise, show a range and identify which assumptions create the largest cost uncertainty.
Should staging and disaster recovery be included?
Yes, when those environments consume billable compute, storage, backups, network transfer, monitoring, or licenses. List each environment separately instead of hiding it in production.
Document operating schedules and recovery requirements. A stopped test server may still incur disk, snapshot, IP, or retained-log charges.
How can teams estimate data-transfer charges?
Measure representative response sizes, upload volume, cache hit ratio, regions, and service paths. Map each flow to the provider’s current transfer category.
Separate internet egress, cross-region traffic, CDN delivery, and internal service transfer. Similar byte totals can have different prices depending on destination.
When are reserved commitments appropriate?
Consider commitments after measuring a stable baseline and confirming the service, region, term, and utilization assumptions. Compare them with the on-demand baseline first.
A discount can create waste when workloads migrate or shrink. Record lock-in, break-even utilization, and ownership before purchasing.
What should trigger an estimate review?
Review after architecture changes, traffic growth, major campaigns, new regions, pricing updates, or material variance between forecast and invoice.
Assign owners and thresholds in advance. Explain each variance, update assumptions, and identify corrective action without masking legitimate growth.









Leave a Reply