


Decide what effective enablement means in CRM

CRM sales enablement metrics should show whether reps can use the process, tools, and information needed to help buyers progress. Counting logged activity alone cannot answer that question.
Connect three layers: data readiness, rep execution, and commercial outcomes. Treat enablement as an operating system for better work, not a scoreboard that ranks people by email volume.
Start with a decision, not a dashboard
Write down the decision to support. For example, do new reps need coaching, are leads waiting, or is a sales play failing to create opportunities?
Then identify the record, owner, event, and time window that define the measure. If two teams use different stage meanings or activity rules, their totals are not comparable.
Start the metric design with these decisions:
- Define the business question and the action it could trigger.
- Name the CRM object and fields that supply the data.
- Set the cohort and date window before comparing results.
- Document exceptions such as reassignment or reopened opportunities.
Keep separate measures separate. A completion rate describes process execution, while conversion or pipeline quality describes an outcome that may have several causes.
Define how the metric changes work
Name who reviews the result, which decision follows, and what evidence could justify coaching, process correction, or another investigation.
Remove measures that lack an accountable response because passive dashboard volume can distract managers from decisions that improve buyer progression.
Measure data quality before trusting activity metrics

A dashboard can look precise while relying on incomplete records. Before setting targets, inspect whether the CRM captures the event, owner, source, stage, and timestamp needed for the calculation.
Use a completeness rate: eligible records with a valid required field divided by all eligible records. Show the numerator and denominator so readers can see the size of the sample.
Build a field-level measurement check
For lead response time, check that assignment and first qualifying engagement timestamps exist. Exclude test records, internal transfers, and records outside the agreed service window.
For opportunity conversion, verify that stage changes are timestamped and that deleted or merged records do not silently disappear from the cohort.
| Data check | Calculation | Response |
|---|---|---|
| Owner completeness | Active-owner records ÷ eligible records | Fix assignment before comparison |
| Source completeness | Known-source records ÷ eligible records | Repair capture; keep Unknown explicit |
| Activity coverage | Valid activities ÷ required activities | Simplify logging or retrain users |
| Stage history | Timestamped deals ÷ reviewed deals | Check history and migration settings |
Set a minimum completeness threshold before publishing a team comparison. If missingness differs by team or source, report that limitation instead of treating blank data as zero activity.
HubSpot’s sales analytics documentation describes how some reports define completed activities and lead response time, including reassignment behavior. Use those product-specific definitions only when your own CRM matches them.
Repair the source workflow before changing targets
If ownership is blank, fix the assignment rule or import mapping. If activity outcomes are missing, simplify the logging form and show users why the field matters.
Recalculate the metric after the fix and compare the same type of records. Keep the old baseline so the team can see whether data capture changed, not just sales behavior.
Repair the source workflow through these controls:
- Assign an owner to each required CRM field.
- Set validation at record creation or assignment where appropriate.
- Monitor blank rates by lead source and integration.
Track rep execution and coverage

Measure whether important work happens consistently across the right accounts and stages. Pair activity counts with a quality signal, such as a recorded outcome or a completed next step.
Track by rep, team, segment, lead source, and tenure. A new hire with a smaller territory should not be compared directly with an experienced seller managing a mature book.
Use activity rates with context
Activity completion rate can be calculated as required activities completed with a valid outcome divided by required activities due in the same period.
Meeting show rate is held meetings divided by booked meetings. Define cancellations, reschedules, and no-shows consistently before comparing teams.
Interpret activity rates through these comparisons:
- Track calls connected separately from calls attempted.
- Track completed follow-ups separately from tasks created.
- Show overdue work and unworked qualified records by age.
- Review account coverage for strategic accounts, not only total touches.
High activity with low connection or low meeting attendance can indicate poor targeting, weak contact data, or a play that needs revision.
For assignment rules and response ownership, see the practical guide to CRM lead routing for high-volume B2B sales.
Interpret activity with routing context
Do not set a universal call quota from a team average. First compare the activity needed for each motion, sales cycle, region, and buyer role.
Review assignment timing, queue age, territory coverage, and account capacity before interpreting a low activity rate as an individual execution problem.
Measure conversion and pipeline quality

Outcome metrics help managers see whether enablement supports buyer progress. Compare defined cohorts rather than mixing records created in different periods or at different stages.
Use conversion as a diagnostic, not a verdict on an individual rep. Deal size, territory, product fit, seasonality, and lead quality can change outcomes independently of training.
Define denominators and time windows
Lead-to-opportunity conversion equals eligible leads from a defined cohort that became opportunities divided by all eligible leads in that cohort.
Stage conversion equals records entering a later stage divided by records that entered the prior stage during the same cohort window. State how reopened or recycled records are treated.
| Metric | Definition | Diagnostic |
|---|---|---|
| Lead response time | First owner interaction minus assignment | Compare median and slowest percentile |
| Lead-to-opportunity | Converted leads ÷ eligible cohort | Segment by source, fit, and territory |
| Stage progression | Next-stage records ÷ prior-stage entrants | Find repeated stalls or reversals |
| Pipeline coverage | Qualified pipeline ÷ remaining quota | Check stage age and close-date changes |
Salesforce’s Sales Engagement reports combine engagement information with standard CRM objects and describe role-specific activity and outcome measures. Treat this as an example of available reporting, not a required scorecard.
Review conversion alongside activity and data quality. A falling rate with stable coverage may need a different response than falling conversion combined with missing ownership and slower first contact.
Read the metric with a cohort example
Suppose 120 accepted leads entered the CRM in April, and 24 became qualified opportunities within 45 days. The cohort conversion rate is 20% for that defined window.
Compare that cohort with another month only after checking source mix, qualification rules, and territory coverage. A changed denominator can make a trend look better or worse.
Read each cohort metric with these checks:
- Keep the entry date and conversion window visible.
- Break out high-volume sources instead of blending them.
- Report small samples with their record count.
Evaluate coaching and content impact

Connect enablement to a CRM-observable behavior. If a course covers discovery, define which behaviors managers will review in calls or deal records.
Compare a baseline period with a post-coaching period for similar cohorts. Record the intervention date and note other changes, such as new routing, pricing, or lead sources.
Separate adoption, behavior, and outcome
Content-use data can show whether a rep opened or shared a playbook, when the platform logs that event. It does not prove that the asset caused a deal to close.
Measure adoption first, then the relevant behavior, and finally the buyer outcome. Keep these as separate steps in a simple enablement scorecard.
Separate enablement evidence through these layers:
- Adoption: target reps completed training or used a supported playbook.
- Behavior: observed discovery, qualification, or follow-up quality improved.
- Outcome: comparable cohorts progressed or converted at a different rate.
Use call review rubrics with a small set of observable criteria. For example, score whether the rep confirmed the buyer’s problem, impact, stakeholders, and agreed next step.
Check reviewer agreement before comparing scores. If managers interpret a rubric differently, calibrate sample calls and revise unclear criteria.
Calibrate coaching evidence across managers
Ask managers to score the same representative calls or records independently, then compare disagreements before using the rubric for team trends.
Revise criteria that depend on interpretation and keep examples beside the rubric so reviewers can apply observable standards consistently.
Build a balanced dashboard and review cadence

Keep the manager view small enough to prompt a decision. A practical starting set includes one data-readiness measure, two execution measures, two outcome measures, and one coaching measure.
Give every chart an owner, definition, filter, refresh schedule, and action. If a metric has no clear next step, remove it or label it as exploratory.
Separate operational alerts from coaching discussion
Use alerts for problems that require timely action, such as qualified leads with no owner or a response-time threshold that has been exceeded.
Use weekly coaching reviews for patterns that need context, such as low meeting show rates or stalled opportunities. Avoid turning every metric into an individual performance warning.
Separate alerts and coaching through these controls:
- Show the trend and the current cohort size.
- Display the definition beside the chart or in a metric dictionary.
- Allow drill-down from team summary to relevant CRM records.
- Restrict sensitive individual data to authorized managers.
HubSpot notes that its completed-activity reports exclude meetings and tasks not marked complete. Similar logging rules can change your totals, so explain them to dashboard users.
Write the metric card before building the chart
Example card: “Lead response time” measures elapsed time from current owner assignment to first qualifying logged interaction, for accepted leads assigned this month.
Set the owner as Revenue Operations, refresh the report daily, and show median plus 90th percentile. A manager can then investigate the slow tail without overreacting to one unusual case.
Write each metric card with these fields:
- Definition: exact numerator, denominator, and time window.
- Breakdowns: team, source, segment, and tenure where sample size allows.
- Action: inspect routing, record completeness, and workload when the threshold rises.
Create a metric contract before publishing

A metric contract turns a chart label into an operating rule. It identifies the decision, calculation, owner, source fields, refresh schedule, and permitted interpretation.
Draft the contract with the manager who will use the measure and the operations owner who understands how CRM events are recorded.
Create the metric contract with these controls:
- State the business question and expected management action.
- Name the eligible records and exclusion rules.
- Identify source fields, timestamps, and system owners.
- Define calculation logic and reporting timezone.
- Document limitations, confidence, and known blind spots.
- Set the review date and change approver.
For conversion rate, specify the starting population and successful outcome. A lead-to-opportunity rate differs from an accepted-lead-to-qualified-opportunity rate.
For response time, distinguish assignment, task creation, first attempt, and meaningful buyer interaction. Choose one event and keep the others available for diagnosis.
Validate calculations against representative records
Choose representative records from different territories, sources, stages, and owner histories. Include reassignment, reopened opportunities, missing timestamps, and integration or import records.
Calculate each result manually from the underlying CRM history, then compare it with the dashboard. Record disagreements as definition, data, query, or timing defects.
Classify validation failures through these categories:
- Definition defect: teams disagree about the event.
- Data defect: the required event is absent.
- Query defect: the report applies incorrect logic.
- Timing defect: refresh or timezone changed the result.
Do not average away invalid records. Show the excluded count and reason so managers understand whether the metric represents the full population.
If many records lack a required event, treat completeness as the first enablement objective. Reliable workflow evidence must precede performance conclusions.
Respond when a metric crosses its threshold

A threshold without an owner or response creates noise. Connect each alert to a review window, responsible role, diagnostic steps, and a reversible intervention.
When response time rises, inspect routing, staffing, ownership changes, incomplete records, and buyer availability before requiring more activity from every representative.
Respond to threshold changes through these steps:
- Confirm the alert uses the approved cohort.
- Inspect representative records from the affected segment.
- Separate process failure from capacity or demand changes.
- Choose one corrective action and define its review date.
- Record whether the intervention improved buyer progression.
Retire or revise the threshold when the sales motion, territory model, product, or CRM process changes. Historical comparisons need an effective date for every definition change.
Confirm the alert before intervening
Verify the definition, cohort, refresh, completeness, and representative records before treating a threshold change as a process or performance failure.
Record competing explanations such as demand, staffing, territory, product, pricing, routing, or logging changes that occurred during the measurement window.
Choose one reversible response
Select the smallest intervention tied to the confirmed cause, then define its owner, expected result, safeguard metrics, and review date.
Preserve the baseline and rollback path so the team can reverse an ineffective change without losing the original operating evidence.
Document the intervention outcome
Record the action, affected cohort, owner, dates, safeguards, observed result, limitations, and decision to keep, revise, or reverse it.
Link the outcome to the original alert so future reviewers can distinguish effective responses from repeated activity without verified improvement.
Implement a practical 30-day rollout

Start with one sales motion and a short list of metrics. A controlled pilot reveals whether definitions, CRM fields, and manager routines work before the dashboard spreads.
Include representatives from sales leadership, frontline management, revenue operations, and enablement. They should agree on metric ownership and how teams will respond to exceptions.
Use four weekly checkpoints
Run the rollout through these weekly checkpoints:
- Week 1: Agree on questions, definitions, and cohorts. Inventory CRM fields and identify data gaps.
- Week 2: Build a basic dashboard and test calculations against a sample of CRM records.
- Week 3: Pilot one team. Managers and reps flag misleading measures or context gaps.
- Week 4: Adjust definitions, name the metric owner, and decide whether evidence supports wider rollout.
Before launch, test at least one known record for every KPI. Confirm its timestamps, stage history, owner, and denominator match the documented calculation.
Keep a change log for dashboard definitions. When a calculation changes, record the effective date so historical reports do not appear to shift without explanation.
Set guardrails against metric gaming
Pair volume measures with quality and buyer outcomes. For example, show calls connected beside calls attempted, and tasks completed beside overdue qualified leads.
Do not reward a team for improving a number by changing how events are logged. Audit samples and ask whether the action genuinely improved the buyer’s experience.
Diagnose conflicting signals before changing the play
If activity rises while conversion falls, compare the same cohort, source, and sales motion before concluding that the team is less effective.
Check whether routing, staffing, pricing, or qualification changed during the measurement window. A simultaneous process change can explain the shift better than training alone.
Diagnose conflicting signals through these checks:
- Confirm the denominator and record population did not change.
- Check field completeness and sample size by segment.
- Review representative CRM records and call outcomes.
- Change one intervention at a time when practical.
FAQ
These answers clarify common decisions about CRM enablement metrics, activity, cohorts, coaching, consistency, compensation, response time, and retirement.
Which CRM sales enablement metric should a team start with?
Start with the decision the team needs to make. Lead response time, activity coverage, conversion, or coaching behavior may fit, depending on the bottleneck and data quality.
Are activity counts a reliable measure of sales performance?
Not alone. Activity counts show recorded work, not its quality or impact. Pair them with outcomes such as connection, meeting completion, progression, and buyer fit.
How should managers compare reps with different territories?
Compare similar cohorts and segments, then account for tenure, territory potential, lead source, and sales motion. Avoid ranking sellers using unadjusted totals.
Can CRM data prove that training caused higher revenue?
Usually not by itself. CRM data can show adoption, observed behaviors, and outcomes over time, but other changes may explain the difference. Describe association carefully.
How often should a sales enablement dashboard be reviewed?
Review operational alerts as often as their response window requires. Discuss coaching patterns weekly or monthly, and revisit definitions whenever the sales process changes.
How can a team measure coaching quality without counting meetings?
Sample documented coaching actions, verify whether the targeted behavior changed, and compare representative opportunities before and after the intervention.
What if sales activities are recorded inconsistently?
Fix activity definitions, integration behavior, and required fields before setting performance targets. Report the completeness gap beside any provisional metric.
Should CRM dashboard metrics determine compensation?
Only after leaders validate definitions, coverage, controllability, and fairness. A diagnostic enablement metric should not silently become an incentive measure.
How should lead response time be validated?
Confirm the clock-start event, business-hours rule, ownership changes, and qualifying response event against a sample of real CRM records.
When should a sales enablement metric be retired?
Retire it when the underlying process disappears, data becomes unreliable, or the measure no longer changes a meaningful decision.
Conclusion

Useful CRM sales enablement metrics link clear definitions to actions. Start with trustworthy data, observe execution, and interpret outcomes in the context of the buyer and sales motion.
Choose a small pilot, publish metric definitions, and review whether the results change a real decision. Expand only when teams can trust the evidence and act on it.
Continue with the implementation framework
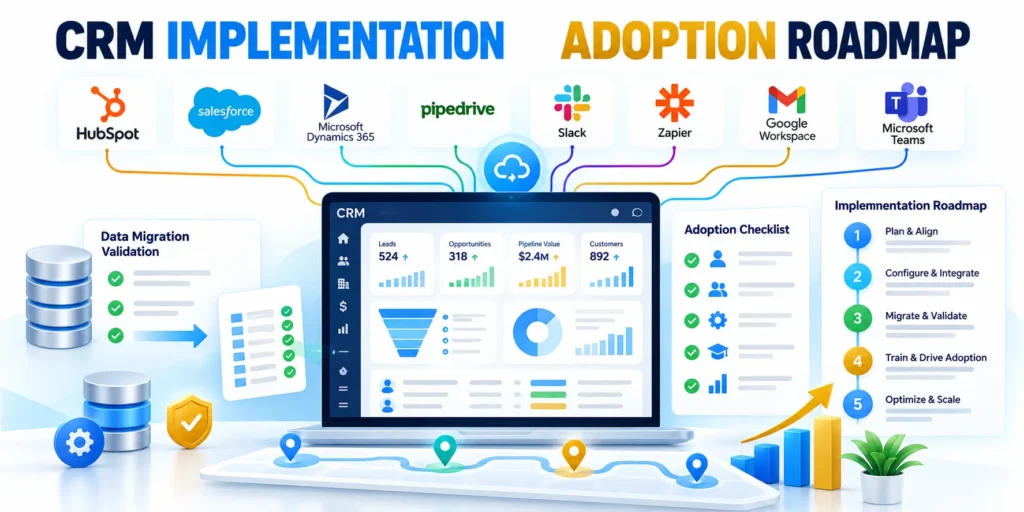
For the broader framework, read Enterprise CRM Implementation: Strategy, Migration, and Adoption.
Connect the metric system to migration, adoption, ownership, and governance decisions so reporting remains part of the operating model.
Carry these controls through every metric review:
- Define the decision and eligible cohort.
- Verify source data before interpretation.
- Pair execution with quality and outcomes.
- Assign a response and review date.
- Retire measures that no longer guide action.
Preserve definitions and operating evidence
Keep metric contracts, fields, queries, cohorts, exclusions, owners, thresholds, interventions, results, limitations, and effective dates together.
This record helps managers distinguish a genuine change in sales work from a reporting, definition, or data-capture change.
Improve one decision at a time
Choose one decision, validate the evidence, test a reversible response, and compare a consistent cohort after enough outcomes mature.
Expand only when teams can reproduce the calculation, explain limitations, support the operating response, and protect buyer experience.
Review before expanding the scorecard
Confirm every measure still supports a decision, uses trustworthy data, and has an owner who can act on the result.
Remove redundant charts before adding new ones so managers retain a focused, explainable, and maintainable review system.








Leave a Reply